
In this primer · 16 sections + glossary
A data center is one of the few places where the digital economy becomes easy to see. Open a door and there are computers. Follow their cables and there are switches, electrical panels, and batteries. Follow their cooling pipes and there are pumps, heat exchangers, and equipment that releases heat outdoors. Beyond the building sit utility connections, construction crews, suppliers, lenders, and customers.
The basic challenge is straightforward: keep a large collection of computers doing useful work, reliably, at a cost someone is willing to pay.
Artificial intelligence raises the stakes. Some AI workloads need unusually powerful processors, move extraordinary amounts of data, and concentrate heat into a small amount of floor space. That makes the supporting infrastructure more demanding. It also makes the relationships between the parts more important. A fast processor does little good if it cannot get data quickly enough. An impressive building produces no computing output before power is available. A full order book does not automatically produce attractive cash returns.
This primer starts with the facility and its equipment, then follows a request through an AI system, and finally explains the businesses that make the system possible. The aim is to give you a connected understanding of the industry: what each layer does, how it affects the others, and which questions help separate real progress from an impressive announcement.
Source and scope. Inspired by Leo Cui’s “The Entire AI Data Center Explained — From Electricity to ChatGPT”, published July 23, 2026. The explanations, examples, and diagrams here are original and draw on the primary sources linked throughout. The article covers general data-center fundamentals with an emphasis on AI. Illustrative calculations are labeled; product examples describe particular systems rather than universal specifications.
The infrastructure around the computers
1. What a data center actually contains
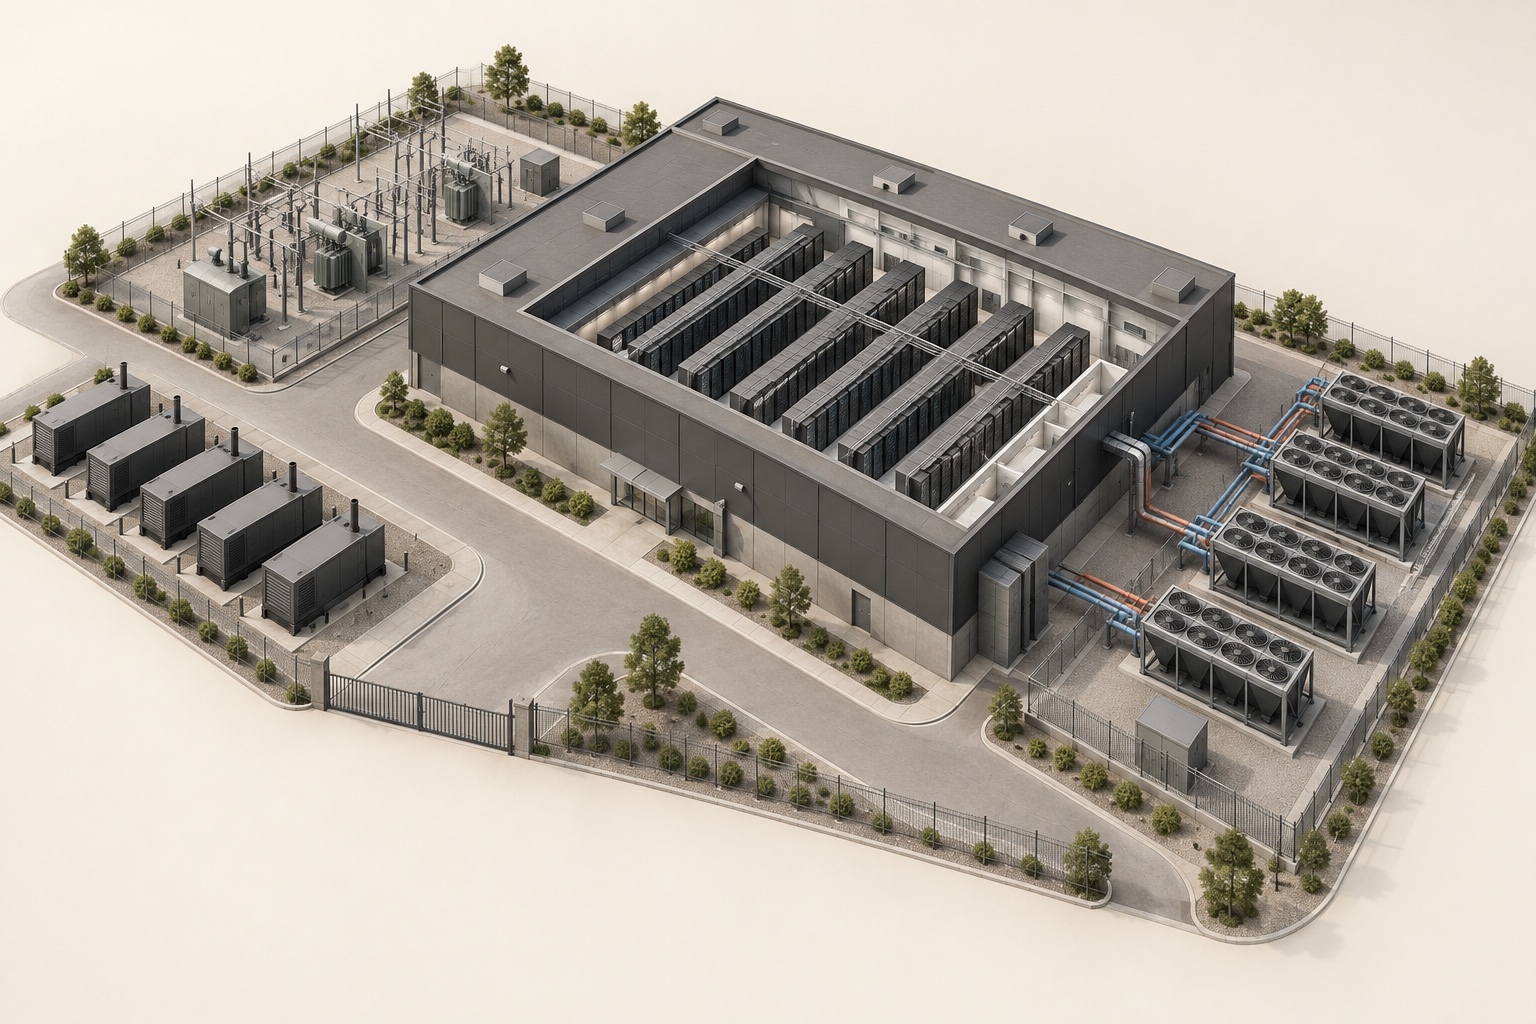
At its core, a data center is a facility that houses computing, storage, and networking equipment, together with the electrical, mechanical, and operational systems needed to support it. A company might run its own building, rent space in someone else’s, or buy computing as a service without owning the underlying equipment. Those arrangements can overlap. A cloud provider can own servers in a building leased from a separate operator. IBM’s overview of data centers provides a useful introduction to these components and operating models.
The physical hierarchy starts small. A chip performs a specialized function. Multiple chips sit on boards inside a server, a computer designed to provide services to other computers. Servers and related equipment are mounted in racks, the tall cabinets commonly shown in photographs. Rows of racks occupy a data hall. Several halls can make up a building, and several buildings can form a campus.
A cluster is a group of computers configured to work together. This is a logical description, so its boundaries need not match the building’s walls. One hall can contain several clusters, and a large service can operate across several facilities. A rack is a physical container; a cluster is a coordinated computing resource.
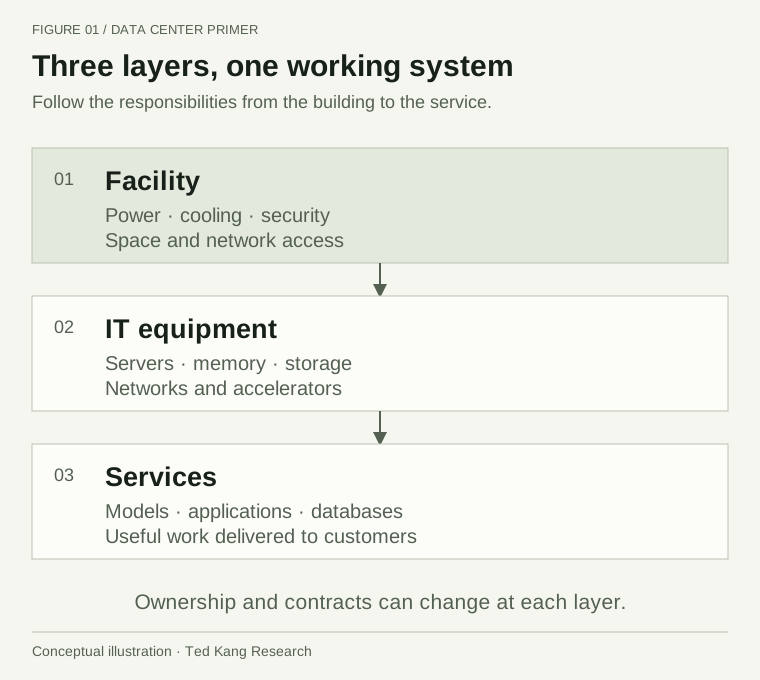
It helps to distinguish three layers of responsibility. The facility layer supplies power, cooling, physical security, and connectivity. The IT layer consists of servers, memory, storage, and networks. The service layer turns that equipment into something a customer can use: a database, website, business application, or AI model.
Colocation usually means placing your equipment in a third party’s facility and buying supporting services such as space, power, cooling, and network access. Cloud computing moves the purchase further up the stack: you consume a computing service rather than managing every physical component yourself. Equinix’s colocation description illustrates the facility and interconnection services involved.
Hyperscale describes the scale and architecture of an operation. It is not a synonym for ownership. Edge describes placement closer to users, devices, or data sources. An edge site may trade some economies of scale for faster response times or local processing. These labels answer different questions, so a useful industry map should not treat them as mutually exclusive boxes.
2. Why AI changes the requirements
Data centers supported demanding work long before modern generative AI: search, streaming, payments, scientific computing, analytics, and business software. The new challenge is the growth of workloads that combine intensive numerical computation with large memory requirements and frequent communication between processors.
A language model represents patterns through numerical values called parameters, often called weights. During training, software adjusts those values to improve the model’s behavior on a training objective. During inference, the trained model processes new inputs and produces outputs. Training is itself a computing workload, distinct from constructing the building or installing the servers.
Training also does not happen only once in any practical sense. A model’s development can include experiments, failed runs, pretraining, fine-tuning, reinforcement learning, evaluation, and later updates. Inference happens repeatedly as people and applications use the model. The relative cost of these activities depends on the model, its development program, and the volume and type of usage.
Text is commonly represented as tokens: units that may be words, pieces of words, punctuation, or other text fragments. Token counts vary with the tokenizer and language. A token is a useful computational and billing unit, but it is not a fixed amount of information or economic value. A short correct answer can be worth more than a long unhelpful one.
The research behind AI scaling helps explain the infrastructure investment. Kaplan and colleagues documented empirical relationships between language-model loss, model size, data, and training compute. Later work on compute-optimal training showed the importance of balancing model size with the amount of training data. These findings helped make larger training programs more predictable to plan. They did not establish that every additional dollar guarantees a commercially valuable improvement. Scaling Laws for Neural Language Models, Training Compute-Optimal Large Language Models.
Two quantities recur in hardware discussions. A FLOP is a floating-point operation; FLOPS measures how many such operations can be performed per second. Hardware performance depends on the numerical precision being used, the kind of calculation, and how effectively software uses the machine. A headline number for low-precision matrix arithmetic should not be compared casually with a different chip’s higher-precision result.
AI is also broader than a chat response. Generating video, processing long documents, or running an agent that makes many model and tool calls can require very different amounts of work. A universal statement that one AI request consumes a fixed multiple of a web search is therefore unreliable. Request length, output length, model choice, caching, hardware, and task complexity all change the comparison.
The practical result is that “AI-ready” must refer to a specific workload and configuration. A facility suitable for modest inference on ordinary servers may need substantial changes to support a tightly connected cluster of dense, liquid-cooled accelerator racks.
3. Inside a server: several kinds of work
The central processing unit, or CPU, handles general-purpose computation. It runs operating-system functions, coordinates work, processes data, and supports the services surrounding an AI model. CPUs remain essential even when an accelerator performs most of the model’s heavy numerical work.
A graphics processing unit, or GPU, is designed for high-throughput parallel computation. AI uses this capability for operations on large arrays of numbers. The GPU’s value comes from its ability to perform suitable work efficiently across many execution units, supported by specialized arithmetic hardware and software.
The server needs more than those two processors. System memory holds data for CPU-side work. Accelerator memory holds model weights and working data near the accelerator. Solid-state drives, or SSDs, store information persistently. A network interface card, or NIC, connects the machine to other systems. Power supplies convert incoming electricity into forms the components can use, while fans or liquid-cooling hardware remove heat.
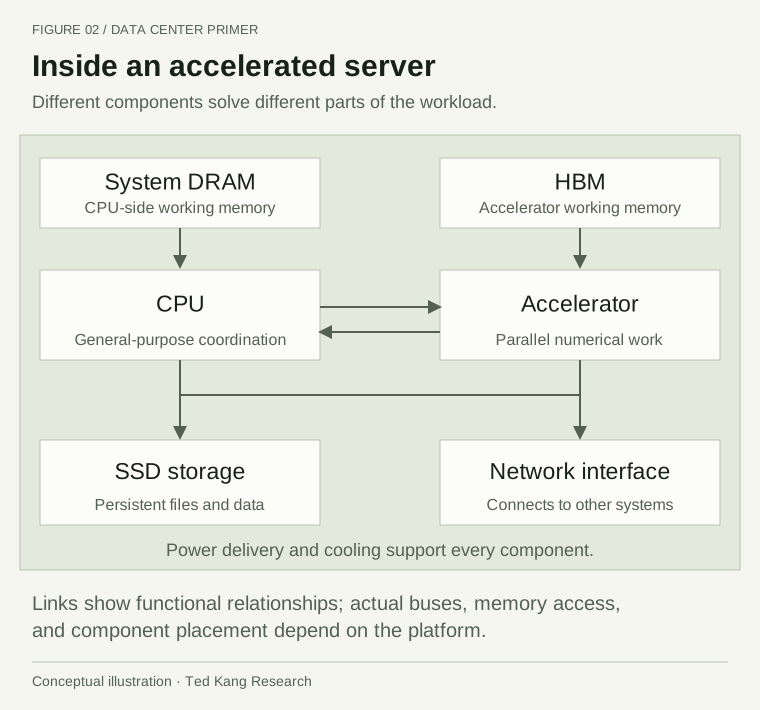
Some systems extend this integration across an entire rack. NVIDIA’s GB200 NVL72, for example, combines 36 Grace CPUs and 72 Blackwell GPUs in a liquid-cooled rack-scale design, with an NVLink domain connecting the GPUs. That is a concrete example of coordinated system design—not a description of every AI rack, and not evidence that a particular chatbot request ran on that hardware. NVIDIA GB200 NVL72.
There is also a distinction between general-purpose programmable accelerators and chips customized for particular workloads. Google’s TPUs and AWS Trainium are examples of purpose-built AI accelerators. Broadcom provides custom accelerator and connectivity technologies. A custom design can optimize around a customer’s requirements, but it also depends on software support, development cost, manufacturing access, and sufficient usage to justify the investment. Google Cloud TPU, AWS Trainium, Broadcom AI infrastructure.
Chip design, chip manufacturing, and server assembly are separate activities. A designer can specify a processor while a foundry manufactures it, a packaging provider combines it with memory, and a system manufacturer integrates it into a server or rack. TSMC’s CoWoS technology is one example of advanced packaging used to connect compute chips and high-bandwidth memory. Packaging is therefore part of the performance and supply-chain story, not merely a protective wrapper. TSMC CoWoS.
When evaluating hardware, the useful question is what the complete system can accomplish. The answer includes the processor, memory, interconnect, software, reliability, and power requirements. Buying the chip with the most impressive isolated specification does not necessarily produce the best operating result.
4. Memory: having enough data nearby, and moving it fast enough
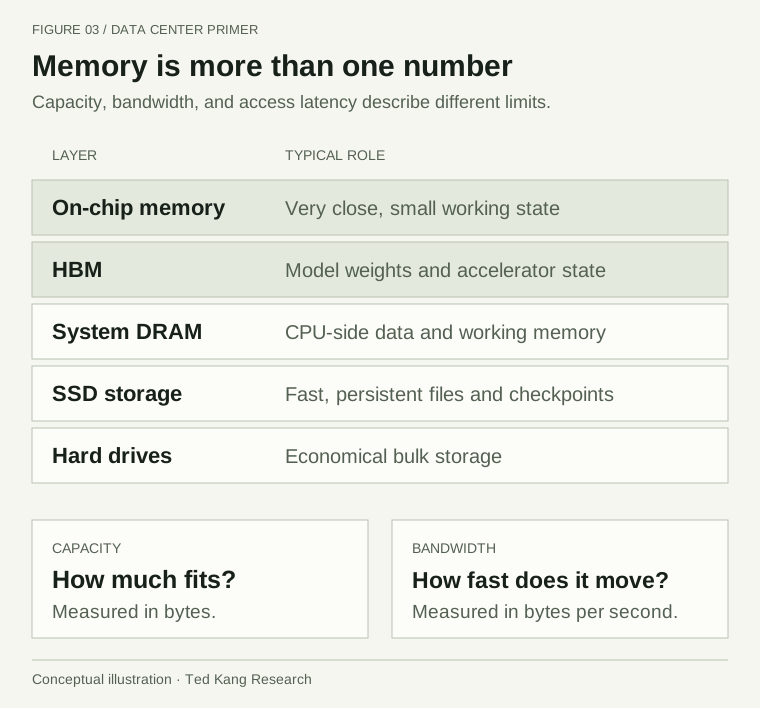
Memory creates two different constraints. Capacity is how much information fits. Bandwidth is how quickly information can move between memory and the processor. A system can have enough capacity to hold a model and still run slowly because it cannot move the required data quickly enough.
High-bandwidth memory, or HBM, addresses data movement by stacking memory dies and connecting them through many short, wide electrical paths. It is typically integrated near the accelerator in the same package. The close integration supports substantial bandwidth, but introduces manufacturing, packaging, thermal, and cost tradeoffs. Micron’s HBM overview explains the role of stacked memory, close processor integration, and shorter connections.
Consider a simplified capacity calculation. A model with 70 billion parameters stored at two bytes per parameter requires approximately 140 billion bytes, or 140 GB, just for those weights. At one byte per parameter, the corresponding figure is 70 GB. At four bits per parameter, it is 35 GB before additional metadata and implementation overhead.
Those are illustrative decimal-unit calculations, not deployment requirements. A running service also needs memory for intermediate results, conversation state, temporary workspace, and the serving software. Training generally requires additional state beyond inference. A model that appears to fit from the weight calculation alone may therefore need more devices or a different configuration.
One further distinction is total versus active parameters. In a mixture-of-experts model, a routing mechanism selects a subset of specialized model blocks for each token. That can reduce the arithmetic performed per token while leaving a much larger collection of weights to store and make accessible. Total parameter count is therefore not the same as the amount of computation used for each token. The Mixtral research paper provides a concrete example of this distinction.
For many autoregressive language models, decoding repeatedly reads model data and the key-value cache, or KV cache. This cache stores attention-related intermediate values from earlier tokens so they do not need to be recreated each time. It is useful to think of it as temporary computational state associated with the context. It is not a permanent database of everything the model knows.
At low batch sizes, moving weights from memory can be a major limit on decoding speed. Longer contexts can make KV-cache traffic more significant. Other configurations can become limited by arithmetic or communication instead. “Inference is memory-bound” is a useful starting point for some workloads, not a rule that applies equally to every phase, model, and serving setup. NVIDIA inference optimization, NVIDIA’s discussion of long-context attention.
Persistent storage serves another purpose. Training data, model files, checkpoints, application documents, and retained outputs need a home outside volatile accelerator memory. SSDs provide fast access; hard drives can provide economical bulk capacity. Storage systems combine media, software, and networks, and their design affects how quickly data reaches compute. Seagate’s discussion of multi-tier AI storage illustrates why more than one storage layer can be useful.
There is no technical requirement to retain every AI interaction forever. Retention is a product, security, legal, and cost decision. More AI activity can create more data, but the amount stored depends on what operators choose and are permitted to keep.
5. Networking: making many machines useful together
Some workloads fit on one accelerator. Others need several because the model or its working state is too large, because more throughput is required, or because the workload is deliberately distributed. A large training cluster may also use many copies of parts of the workload rather than placing a unique slice of the model on every chip.
Data parallelism spreads different batches of data across devices that perform related work. Tensor parallelism splits portions of a calculation across devices. Pipeline parallelism assigns stages of the model to different devices. These approaches create different patterns of communication. The relevant network is the one that supports the actual pattern, not simply the one with the largest advertised speed. The Megatron-LM research illustrates how model and data parallelism can work together.
The common distinction is between scale-up, which tightly connects accelerators within a coordinated system or domain, and scale-out, which connects systems into a larger cluster. The boundary is architectural rather than permanently fixed at the edge of a rack. NVLink is an example of a scale-up interconnect. Ethernet and InfiniBand are widely used in scale-out networks. NVIDIA itself offers both Ethernet and InfiniBand products, so the market cannot be reduced to NVIDIA versus Ethernet. NVIDIA networking platforms.
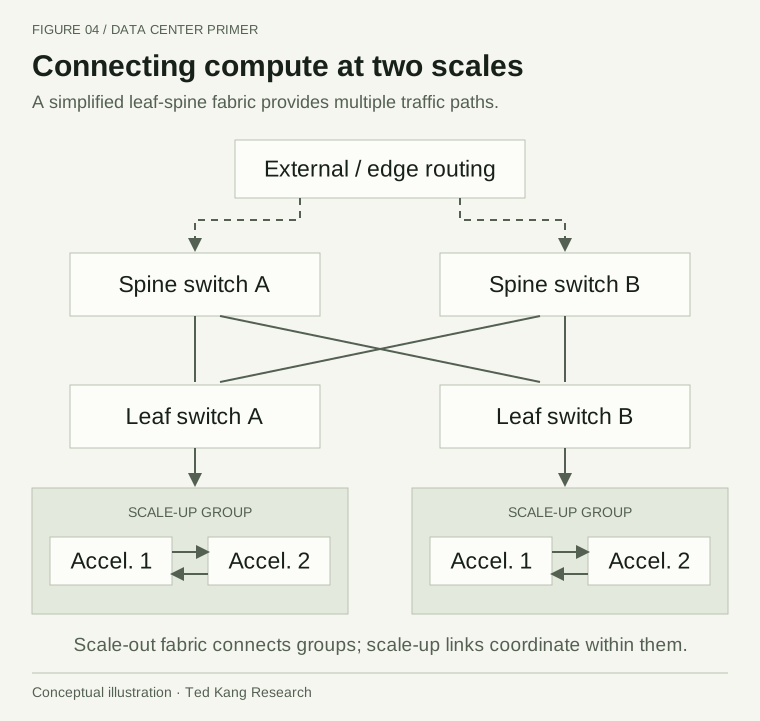
Bandwidth measures the amount of data that can move in a given time. Latency measures delay. Congestion arises when traffic competes for limited resources. A model waiting for another device’s result may be sensitive to all three. The communications traffic among servers—often called east-west traffic—can be very different from traffic entering and leaving a website.
A leaf-spine design gives server-facing switches multiple paths through a set of backbone switches. This can reduce bottlenecks compared with a network built around a small number of heavily shared uplinks. But the topology alone does not guarantee performance: port counts, link speeds, oversubscription, routing, and congestion control matter. Arista’s leaf-spine design considerations.
Copper and optical links serve different distances and engineering requirements. Copper can be attractive for short connections. Optical links carry information as light through fiber and become valuable where distance, bandwidth, and electrical signal loss make copper less suitable. An optical transceiver performs electrical-to-optical and optical-to-electrical conversion; the fiber carries the signal. Optical signal-processing chips, lasers, connectors, and assembly are distinct parts of that supply chain. NVIDIA interconnect products, Lumentum datacom transceivers, Marvell optical DSPs.
Co-packaged optics brings optical engines closer to a switch or compute package to shorten demanding electrical paths. It can change power and packaging economics, while introducing questions about serviceability, manufacturing, lasers, and thermal management. It does not mean that every cable becomes optical or that existing optical modules immediately disappear. Broadcom’s optics overview.
6. Power: understanding the units before the headlines
Data centers are often described in megawatts, but a megawatt is a rate of energy use, not an amount of energy. One megawatt equals 1,000 kilowatts. A facility drawing one megawatt continuously for one hour consumes one megawatt-hour, or 1,000 kilowatt-hours.
This distinction makes a large project easier to understand. If a facility draws 100 MW continuously for a year of 8,760 hours, it consumes 876,000 MWh, or 876 GWh. If 100 MW instead describes maximum capacity and average demand is lower, its annual energy consumption will be lower. Capacity, connected load, and actual use should not be treated as interchangeable.
There is another boundary to check: does the announced capacity refer to IT power or the whole facility? IT power supplies computing, networking, and storage equipment. Facility power also includes cooling, power-conversion losses, lighting, and other supporting loads. Announced capacity may describe an eventual campus buildout rather than equipment that is operating today.
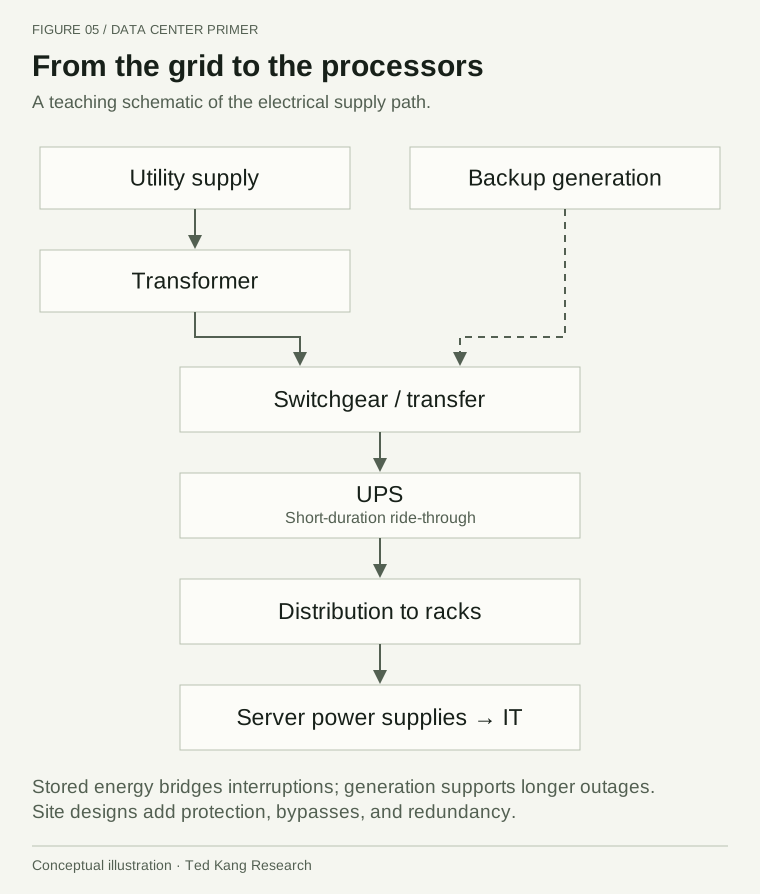
The electricity follows several steps. The utility connection and substation bring power to the site at an appropriate voltage. Transformers change voltage. Switchgear protects circuits and controls distribution. An uninterruptible power supply, or UPS, provides conditioned power and temporary ride-through when its upstream supply is disrupted. Distribution equipment delivers power toward racks, and server power supplies perform further conversion. Actual arrangements vary and can include bypasses, duplicated paths, and different AC or DC architectures. Schneider Electric’s electrical-distribution guide.
Consider what happens during a grid outage. Stored energy in the UPS maintains the protected load while a standby generator starts and reaches acceptable operating conditions. Transfer equipment then connects the backup source, allowing it to supply the load through the power system. The generator therefore supports a longer interruption; the UPS bridges the gap. Runtime and the equipment covered depend on the design, so this sequence does not imply that every pump, fan, or chiller has battery backup. Eaton’s UPS and generator guidance.
Rack density measures how much power equipment draws within a rack. It matters because that power must be delivered to a small area and the resulting heat removed from it. A hall with sufficient aggregate megawatts may still lack the electrical connections, floor capacity, pipework, or cooling capability needed for a particular dense rack.
The electricity bill is also more complicated than energy multiplied by a single quoted rate. Depending on the tariff and contract, it can include demand charges, capacity charges, delivery charges, taxes, and other adjustments. A low headline energy price is not a complete description of the cost or reliability of power at a site.
For context, the IEA’s April 2026 outlook estimates that global data-center electricity consumption increases from about 485 TWh in 2025 to 950 TWh in 2030. The latter is a projection, not an observed outcome, and includes data centers beyond AI. The same report describes tightening constraints in grids, transformers, turbines, and advanced IT equipment. IEA, Key Questions on Energy and AI.
Follow the power, including an interruption
The grid supplies the site through its agreed connection. The available capacity and delivery conditions are specific to that location.
7. Securing electricity is a project of its own
A connection to the grid requires more than finding a nearby transmission line. The utility and relevant system operator need to determine whether the load can be served reliably, what upgrades are required, and under what conditions the site can be energized. A large-load connection process is different from the queue for adding a new power plant, even when the two interact.
ERCOT’s large-load materials provide a useful example of the studies and coordination involved. They also show why placing generation alongside a data center does not automatically remove grid-related requirements. Local generation, withdrawal limits, and interconnection treatment depend on the actual design and applicable process. ERCOT large-load integration, ERCOT interconnection questions and answers.
The term behind the meter generally refers to generation or other resources on the customer’s side of the utility meter. On-site generation can help a project, but it brings its own construction schedule, fuel supply, emissions requirements, maintenance, redundancy, and equipment constraints. It should be evaluated as a power system rather than assumed to be a shortcut that eliminates all delays.
Different electricity sources offer different combinations of timing, operating characteristics, cost, and environmental impact. Existing nuclear plants can supply substantial low-carbon electricity, but individual plants still have maintenance and outage schedules. New nuclear projects, including small modular reactors, require attention to licensing, financing, manufacturing, construction, and fuel. A prospective agreement is not the same as operating generation.
Natural-gas engines, turbines, and fuel cells can serve different on-site or grid roles. Natural-gas fuel cells use an electrochemical process, but using gas does not make them carbon-free. Wind and solar can provide low-cost energy in suitable locations, while their variable output requires a plan for the hours when it is unavailable. Storage shifts energy across time; it does not create the primary energy that charges it.
Geothermal and some hydropower resources can also contribute dependable low-carbon supply. Nuclear is therefore not the only potential source of around-the-clock low-carbon electricity. What matters is the resource available at a particular location and how the whole system meets demand. Department of Energy on geothermal power.
A power purchase agreement, or PPA, sets commercial terms associated with electricity. A physical PPA provides for electricity delivery or transfer of title at an agreed point. A financial or virtual PPA settles a contract price against a market price; it does not deliver electricity to the buyer’s building. The buyer still needs local electricity service. Renewable energy certificates may be included or handled separately, so ownership of those attributes also matters. Neither contract structure, by itself, proves that the site has an energized utility connection or carbon-free supply every hour. Matching annual renewable purchases to annual consumption is different from matching the facility’s needs at each place and time. EPA on physical PPAs; EPA on financial PPAs.
The development question is consequently broader than “How much power has been announced?” Ask how much is available now, how much has an executable delivery path, what upgrades remain, who pays for them, and what happens if the schedule slips. Power at the wrong time can be almost as unhelpful as power in the wrong place.
8. Cooling: moving heat through a series of systems
Most electricity consumed by IT equipment ultimately becomes heat. The cooling system must move that heat away quickly enough to keep components within their operating limits. Failure to do so can reduce performance, trigger protective shutdowns, or damage equipment.
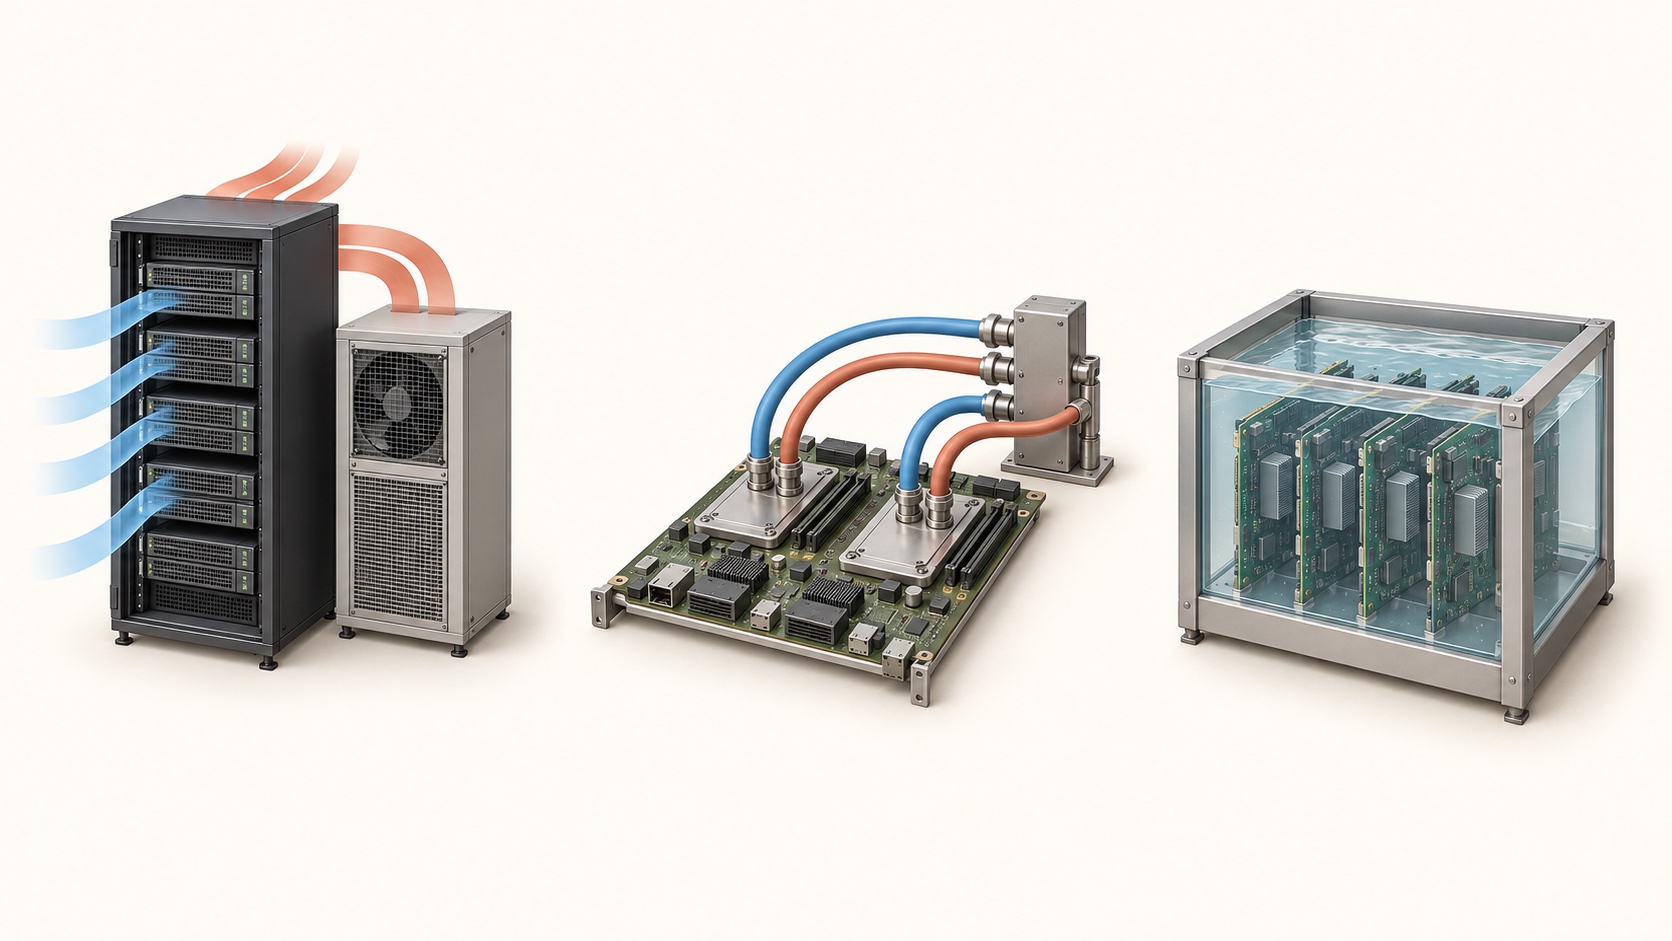
Air cooling moves air across hot components and transfers the heat to a cooling system. Good airflow management keeps warmer exhaust from mixing unnecessarily with cooler supply air. Hot-aisle or cold-aisle containment can help. Raised floors are one possible distribution method, not a requirement for every data center. The Department of Energy’s data-center design guide explains the relationship between airflow, equipment requirements, and facility efficiency.
At higher heat densities, liquid can carry heat away from components more effectively within the available space. Direct-to-chip cooling places cold plates against selected components and circulates coolant through them. A rear-door heat exchanger removes heat from air leaving the rack. Immersion cooling places suitable equipment in a dielectric fluid that does not conduct electricity in the way ordinary water does. These approaches have different installation and maintenance requirements; they are not a universal ladder that every facility must climb.
A liquid-cooled server can still need airflow. Cold plates may capture heat from its hottest processors while memory, networking, power supplies, or other components continue to release heat into the room. The design must handle that residual heat as well. Some systems capture almost all of the equipment’s heat in liquid; others combine liquid and air cooling. The label alone does not tell you the split. DOE’s design guide, section 5.6.
A coolant distribution unit, or CDU, commonly separates the controlled coolant circuit near the IT equipment from a facility cooling circuit, using a heat exchanger. It can regulate temperature, pressure, flow, and fluid quality. Depending on the design, heat may instead be transferred to room air. The purpose is to provide controlled heat transfer, not simply to circulate arbitrary building water through expensive electronics. Vertiv on CDUs.
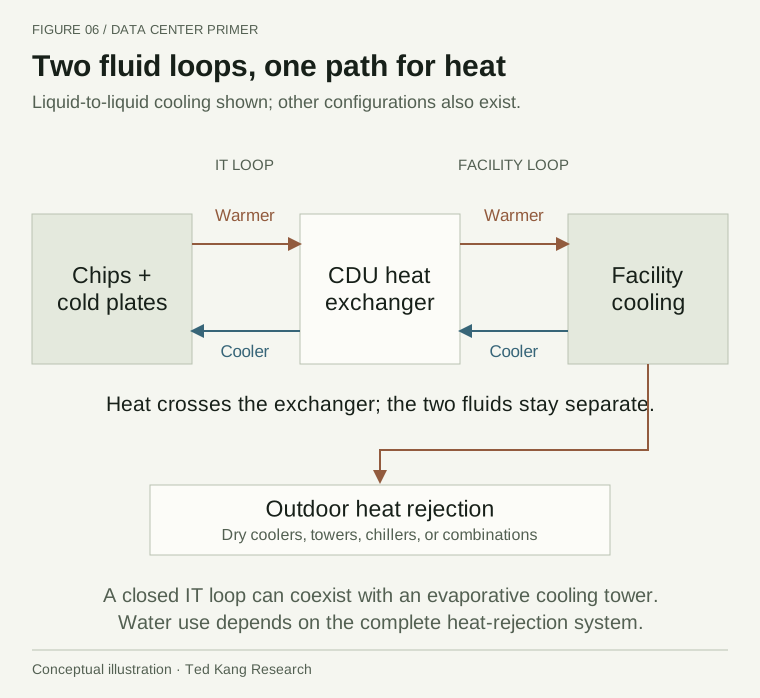
The heat still needs somewhere to go after it leaves the server. Facility equipment can reject it using dry coolers, chillers, cooling towers, or combinations of systems. The appropriate design depends on climate, supply temperatures, space, water availability, and reliability requirements. Warmer usable coolant temperatures can sometimes reduce mechanical cooling work, but the result is specific to the installation. Vertiv’s fluid-network guide.
Here is a crucial distinction: liquid cooling does not automatically mean high water consumption, and a closed IT coolant loop does not automatically mean zero water consumption. A cooling tower can consume water through evaporation even when the fluid circulating near the chips remains in a closed loop. Dry heat rejection can reduce direct water use but may involve other energy, space, or cost tradeoffs. The Department of Energy’s cooling-water guidance makes this separation clear.
Water reporting also needs a boundary. Water withdrawn is not necessarily the same as water consumed. Direct site use is different from water used in electricity generation elsewhere. The local significance depends on where and when the water is taken, the source, and the surrounding watershed. A single “water per AI request” estimate can hide all of those choices. DOE guidance on water and energy tradeoffs.
Heat reuse can be valuable where there is a nearby customer for the right quantity and temperature of heat. Distance, seasonality, equipment cost, and the need for heat pumps may determine whether it works. A potential district-heating connection is therefore a project to evaluate, not free revenue that should be assumed for every campus. Lawrence Berkeley National Laboratory on thermal integration.
Three ways to collect the heat
Follow the heat from the chip to the outdoors
Electrical work produces heat in chips and other equipment. Heat sinks help transfer it into the moving air.
9. Efficiency and reliability measure different things
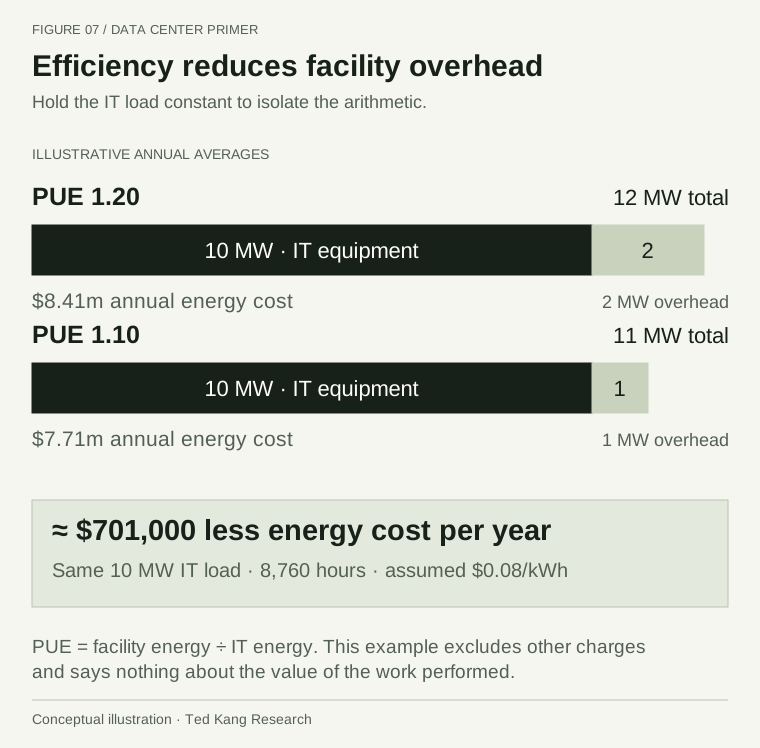
Power usage effectiveness, or PUE, is the ratio of total facility energy to IT equipment energy over the same period and boundary. A PUE of 1.20 means that for every unit of energy used by IT equipment, the facility uses 0.20 additional units in supporting systems. That overhead includes more than cooling. Lower PUE generally indicates lower facility overhead relative to IT energy. DOE’s data-center design guide, section 8.1.
Consider a deliberately simple example: a site averages 10 MW of IT load throughout the year and has an annual PUE of 1.20. It therefore averages 12 MW of total facility load. Over 8,760 hours, it consumes 105.12 GWh. At an assumed flat energy price of $0.08 per kWh, that energy costs about $8.41 million per year.
If annual PUE improves to 1.10 while IT energy and the assumed price stay unchanged, the energy cost falls to about $7.71 million. The difference is approximately $701,000 annually. This example excludes demand charges, taxes, construction cost, financing, and all non-electricity operating expenses. It demonstrates arithmetic, not a forecast for a real property.
A well-cooled idle computer still consumes energy. PUE does not directly measure model quality, revenue, useful work per kilowatt-hour, or the efficiency of software. It should be read alongside utilization and workload-specific performance. Comparisons also need consistent measurement periods: a favorable instantaneous reading is not the same as annual performance across weather and load conditions.
Reliability asks whether the service can continue through failures and maintenance. N is the capacity required for the design load. N+1 adds a spare capacity component. 2N describes two full sets of capacity. These shorthand labels do not tell you whether the distribution paths, controls, maintenance procedures, and other dependencies actually support the desired outcome.
Uptime Institute distinguishes, among other things, concurrent maintainability—planned maintenance without interrupting IT operation—from fault tolerance, which addresses an unplanned failure. Its Tier framework does not guarantee a specific number of downtime minutes each year. Operations still matter. A sophisticated design can be undermined by a common dependency or a poorly executed procedure. Uptime Institute’s explanation of Tier misconceptions.
Resilience also exists in software. Applications can replicate data, retry work, recover from checkpoints, or move service to another location. Training checkpoints preserve progress so an interruption need not destroy an entire run. The appropriate combination of facility resilience and application resilience depends on the cost and consequences of disruption.
The tradeoff is real: more redundancy can require more equipment, floor space, maintenance, and capital. The objective is an appropriate level of service reliability, supported by evidence and operating discipline.
Where the electricity goes
10. From an announcement to an operating campus
A data center passes through several distinct stages: site selection, design, permitting, power arrangements, procurement, construction, equipment installation, commissioning, and customer deployment. Many activities overlap, but important dependencies remain. Servers cannot deliver their intended service merely because the shell of the building is finished.
Commissioning verifies that installed systems perform as intended, including how they behave together. Equipment that works individually can fail during a transfer, fault, or control-system transition. Testing power and cooling under realistic loads, checking protection and alarms, and proving operating procedures help turn installed capacity into dependable capacity.
When reading a project announcement, ask which stage it describes. “Planned capacity” may be a long-term ambition. “Contracted power” may be scheduled for delivery over several years. “Energized capacity” indicates an electrical milestone, but still does not tell you how much IT equipment is installed, available to customers, or generating revenue.
This creates several possible bottlenecks. A site may have the necessary land but lack an executable utility schedule. Another may have power but be waiting for transformers, cooling equipment, or specialized labor. A third may be physically ready but have a networking, software, or customer-acceptance issue that delays service.
It is useful to think of the project as a set of clocks. The building has a construction clock. The power connection has an infrastructure clock. The hardware has a technology clock. The customer contract and financing have their own start dates and obligations. Attractive project economics require those clocks to line up.
For example, buying accelerators far ahead of a usable facility can expose the owner to storage costs, financing costs, and technological aging before the equipment earns revenue. Waiting too long can create the opposite problem: a finished facility with too little hardware to serve customers. This is an original scheduling example; its significance depends on purchase terms and delivery commitments.
The site’s relationship with its community is part of execution, too. Noise, water, transmission construction, emissions from generation, land use, and who pays for utility upgrades can all affect a project. These are practical questions about local infrastructure and public acceptance. The IEA’s 2026 assessment identifies such constraints as relevant to the pace of development.
The strongest milestone is useful service delivered to customers at the promised standard. Even then, ongoing maintenance, staffing, security, capacity management, and equipment replacement continue for the life of the operation.
11. What happens when an AI request arrives
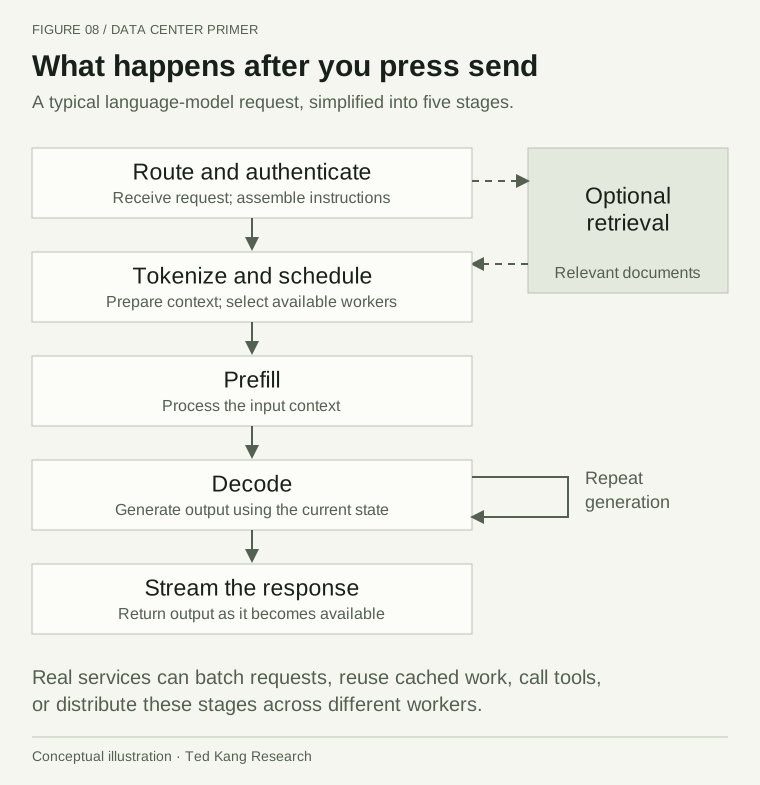
With the physical system in place, we can follow a typical text-generation request. The exact arrangement varies by provider and application, and a request may involve multiple models or facilities. The sequence below is a conceptual example, not a claim about the proprietary architecture behind a particular product.
The request travels through access networks and the internet or a private network to the service. Front-end systems authenticate the user, apply relevant controls, route the request, and assemble the context. That context can include the user’s message, prior conversation, application instructions, and retrieved information.
The system converts text into tokens and schedules the request on suitable computing resources. There may be a queue. The model then processes the input in a stage commonly called prefill. For many transformer language models, this work can exploit parallel computation across input tokens while building the state needed for generation.
Decode generates output conditioned on the context and previous output. In a simple autoregressive description, the model predicts successive tokens. Modern serving systems can use optimizations such as speculative decoding, so it is too literal to imagine every visible word arriving through exactly one unoptimized pass. User interfaces may also buffer and combine output before displaying it.
Time to first token measures how long a request waits before output begins, with the measurement boundary specified. It can include network delay, queueing, prompt processing, and other service overhead. Inter-token latency measures the time between generated tokens; throughput describes output across requests over time. A service can achieve high aggregate throughput while individual users experience noticeable delay. NVIDIA’s inference-benchmarking concepts.
Prefill itself need not process every prompt as one uninterrupted block. Chunked prefill divides the work into smaller pieces so a serving system can balance incoming requests with ongoing generation. Some deployments also place prefill and decode on different workers, which introduces another data-transfer and scheduling problem. NVIDIA on chunked prefill, NVIDIA Dynamo.
If an application searches documents or uses external tools, the workflow becomes a sequence of calls rather than a single trip through one model. A document assistant may retrieve passages, generate an initial answer, check citations, and ask another model to evaluate the result. An agent may repeat this cycle many times. Infrastructure requirements depend on that whole workflow.
That is why measuring only the speed of one model invocation can be misleading. For the user, the useful metric may be the time to a correct completed task. For the operator, it may be the cost of delivering that outcome within the promised latency and reliability.
12. Software determines how much hardware becomes useful output
The software stack begins with operating systems and drivers, then adds programming tools, numerical libraries, orchestration, serving engines, and application logic. Each layer can influence how effectively the hardware is used.
NVIDIA’s CUDA platform includes the programming environment, libraries, and developer tools used to run accelerated applications on its GPUs. AMD’s ROCm provides an alternative software stack for GPU computing. Switching platforms is therefore a question of application compatibility, supported operations, performance tuning, debugging, deployment, and staff experience. The migration effort varies considerably; it is not automatically a complete rewrite or a frictionless swap. NVIDIA CUDA, AMD ROCm.
Cluster-management tools decide where workloads run and how services recover or scale. Kubernetes manages containerized workloads and services; it is one option within a broader operating environment, not a requirement that every data center use the same scheduler. Specialized AI workloads may need additional placement, queueing, and coordination logic. Kubernetes concepts.
Serving engines improve inference efficiency in several ways. Batching processes work from multiple requests together, potentially sharing weight movement and making better use of the accelerator. Continuous batching allows requests to enter or leave as they progress rather than forcing an entire fixed group to finish together. These techniques can improve throughput, while the scheduling policy determines the effect on individual latency.
Caching reuses work when the relevant inputs and conditions match. KV caching avoids repeated computation within a sequence. Prefix caching can reuse state for shared prompt prefixes across requests. These are different from caching a finished answer. Memory management matters because poorly allocated cache space can limit how many requests a system can serve. The PagedAttention paper explains one influential approach to this problem.
Quantization uses lower-precision representations for certain model values. It can reduce storage and bandwidth requirements and take advantage of supported hardware instructions. The performance benefit and accuracy impact need testing on the actual task. Speculative decoding proposes candidate tokens and verifies them with the target model, potentially reducing generation time when the method and workload are well matched. The vLLM documentation describes support for these and other serving techniques.
For enterprise applications, retrieval-augmented generation, or RAG, supplies relevant external information as context for generation. An application might search an authorized document collection, select passages, and ask the model to answer with those passages available. The foundational RAG research combines retrieval with language generation; production implementations use varied retrieval systems and architectures.
A vector database is one possible component, not a requirement for every RAG system. Keyword search, structured queries, reranking, permissions, freshness, and citations can all matter. Retrieval does not itself guarantee accuracy. The system still needs to find the right material, enforce access rights, and use the material appropriately.
Software improvements can reduce the equipment or time needed per task, but that does not determine who keeps the economic benefit. It may appear as higher provider margins, lower customer prices, more usage, or some combination. This is a business outcome to measure, not a guaranteed consequence of a benchmark improvement.
13. The industry contains several different businesses
“Data-center exposure” can refer to owning real estate, selling chips, manufacturing electrical equipment, running a cloud platform, or providing an AI application. Those businesses have different assets, customers, cost structures, and risks.
The table below is a functional orientation map. The examples identify roles discussed in this primer; they are not market-share rankings or investment recommendations.
| Layer | What the customer is buying | Examples and primary-source context |
|---|---|---|
| Facilities and interconnection | Space, power delivery, cooling, physical operations, and connectivity | Equinix |
| Power and thermal equipment | Electrical distribution and controlled heat removal | Schneider Electric, Vertiv |
| Accelerators and software platforms | High-throughput computation and the tools to use it | NVIDIA, AMD, Google TPU, AWS Trainium |
| Custom silicon and packaging | Specialized chip designs and integration of compute and memory | Broadcom, TSMC |
| Memory and storage | Working capacity, data bandwidth, and persistent storage | Micron, Seagate and its described SK hynix collaboration |
| Networks and optics | Reliable movement of data inside and between systems | Arista, NVIDIA, Marvell, Lumentum |
| Specialized clouds | Access to an operated compute platform | CoreWeave’s description in its March 2025 filing |
| Models and applications | Model access, software features, or completed tasks | Products can be sold through APIs, subscriptions, enterprise contracts, or embedded features; the commercial arrangement determines the revenue model. |
System manufacturers and integrators are another important layer. Their work includes sourcing components, assembling and validating systems, installing cooling connections, delivering racks, and providing support. The value of a finished system can include expensive components purchased from other suppliers. Consequently, a large revenue figure at the assembly layer does not imply that the same proportion of value is retained as profit.
This illustrates the difference between gross margin and gross profit dollars. A company with a modest percentage margin can still generate substantial gross profit dollars, while a high-margin supplier may face heavy development costs, customer concentration, or a cyclical demand profile. Comparing percentages without understanding the business can mislead.
Hyperscalers operate broad platforms with many services and workloads. Specialized clouds, often called neoclouds, concentrate more heavily on accelerated computing and related services. An AI lab develops models; an application company turns models into a user-facing product. A single organization can occupy several of these roles, and one provider can be another provider’s customer.
The durable advantage differs by layer. It might be a difficult-to-replace location, an energized utility connection, trusted operating performance, manufacturing yield, software compatibility, customer distribution, or the ability to deploy quickly. Scarcity can create bargaining power, but a temporary shortage is not automatically a permanent competitive advantage.
14. Following the money without counting it twice
There are three money flows to keep separate: payment for a product or service, investment in a company or project, and borrowing that must be repaid. They can connect the same companies while creating very different obligations.
Imagine an application company paying a model provider. The model provider pays a cloud operator. The cloud operator pays for hardware, electricity, facility services, and staff. Each supplier may report revenue from its own customer, but adding all those revenues together overstates the amount spent by the ultimate user. Much of the same money is passing through successive layers.
Now introduce financing. Equity investors and lenders provide funds so equipment can be purchased before the full stream of customer cash arrives. A supplier might also invest in a customer, and that customer might buy the supplier’s products. Such relationships can support deployment, but the investment itself does not establish independent end-user demand.
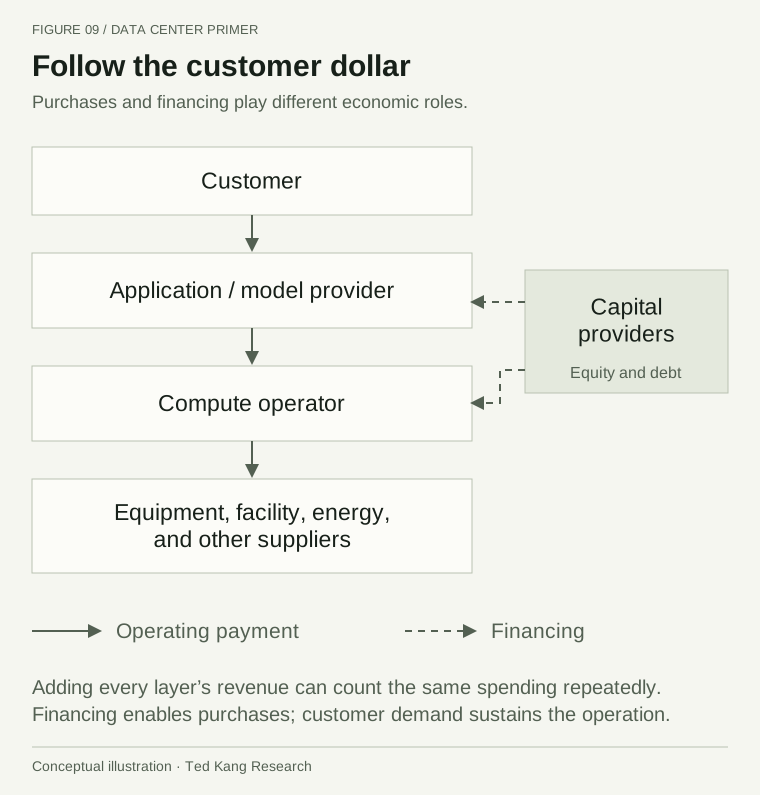
The central question is whether the service creates enough durable economic value to support the obligations throughout the chain. That value is broader than chatbot subscriptions. It can include enterprise software revenue, advertising improvements, better search, scientific applications, internal productivity, or other products. But the benefit still needs a credible connection to cash generation or avoided cost.
A contract can improve visibility without eliminating risk. A take-or-pay arrangement generally requires payment for reserved capacity even if the customer uses less than expected, subject to its actual terms. Customer credit, delivery conditions, termination provisions, and service obligations still matter. CoreWeave’s March 2025 registration filing describes both committed and on-demand purchasing models; it is a historical example of contract structure, not a statement of the company’s current financial position. CoreWeave S-1/A.
This distinction also separates commercial utilization from technical utilization. A reserved machine may be billable while doing little work. A busy machine may be running free trials, internal experiments, or workloads that are priced poorly. Neither utilization measure is meaningful until its definition and economic connection are clear.
Backlog, remaining performance obligations, annualized revenue, and recognized revenue answer different questions. A backlog figure follows the company’s disclosed definition. Remaining performance obligations concern contracted revenue yet to be recognized under applicable accounting. Annualized revenue extrapolates a recent period; it does not mean that amount has already been earned over a full year. Recognized revenue is reported for the accounting period. None of these automatically equals collected cash or profit.
An upfront customer payment makes the timing difference easier to see. Cash may arrive before the operator has earned the corresponding revenue; the unearned amount is recorded as deferred revenue until the promised service is delivered. Conversely, recognized revenue can remain an unpaid receivable. A signed contract, cash collected, and revenue earned are therefore distinct milestones. CoreWeave’s historical filing describes this contract-to-cash sequence.
Infrastructure costs have timing differences as well. Buying equipment uses cash upfront or creates a financing obligation. Depreciation allocates the equipment’s cost over an estimated useful life. Extending that life can reduce annual depreciation expense without reversing the original cash outlay. Economic usefulness depends on future performance and demand; accounting life is an estimate that should be assessed separately.
Leasing also does not make obligations disappear. Microsoft’s 2025 annual report describes operating and finance leases, associated assets and liabilities, and commitments for leases that had not yet commenced. The lesson is to examine the whole obligation, including timing and financing, rather than assuming leased infrastructure is economically free or absent from the balance sheet. Microsoft 2025 annual report, property, equipment, and leases.
Finally, compare like with like. A multi-year campus investment should not be compared directly with one quarter’s revenue. Total capital expenditure from diversified technology companies is not identical to spending exclusively on AI, nor is it directly comparable with the revenues of only two model providers. Useful analysis aligns scope, period, asset life, and cash flows.
15. What determines whether the economics work
The following simplified example is an original illustration, not a company forecast or a market-price estimate. Suppose an operator has 1,000 equivalent accelerator units available for 8,760 hours in a year. At a realized rate of $2 per paid unit-hour, annual compute revenue would be:
| Paid share of available hours | Paid unit-hours | Illustrative annual revenue |
|---|---|---|
| 40% | 3,504,000 | $7.01 million |
| 60% | 5,256,000 | $10.51 million |
| 80% | 7,008,000 | $14.02 million |
This deliberately simple calculation shows why utilization and price interact. If the realized rate falls from $2 to $1.50, the operator needs 80% paid utilization to generate the same revenue as 60% utilization at $2. Higher occupancy does not automatically offset lower pricing.
Revenue is only the beginning. The operation must cover power, facility services, networking, maintenance, staff, software, and other costs. It must also recover the cost of its equipment and compensate the capital providers for time and risk. Some costs vary with use; others remain even when machines are idle.
For a token-based service, the corresponding logic is completed, billable work multiplied by realized price, less the cost of delivering it. A higher token count can reflect more useful demand, longer answers, greater reasoning effort, or inefficiency. The commercially useful measure depends on what the customer is actually paying to achieve.
Hardware refresh adds another dimension. New equipment may provide lower cost per task or better performance, putting pressure on the price of older capacity. But older equipment does not necessarily become worthless overnight. It can remain useful for appropriate models and workloads if the operating cost and selling price still make sense.
The physical facility may also have a longer life than the equipment inside it. However, a reusable shell is not proof that it can cheaply accommodate any future rack. Higher density, different voltage architectures, liquid-cooling requirements, floor loads, and network designs can require additional investment. The residual value of the building and the residual value of the compute fleet should be considered separately.
This leads to a practical set of questions. Is capacity actually ready for service? Does it perform at the promised standard? Are customers paying, and are they likely to continue? Do the contracts protect cash flow under realistic downside conditions? Can the provider refresh equipment and service its obligations while still earning an acceptable return?
Cheaper computation creates both opportunity and pressure. It can make more applications viable and expand demand. It can also reduce the selling price of an existing service. Whether demand grows enough to offset falling unit prices is an empirical question. A growing industry can still contain weak businesses, and a valuable technology can still be financed on unattractive terms.
A busy machine and a paying customer are different things
16. Reading the next data-center headline
Once the layers are connected, most industry headlines can be translated into a few concrete questions.
If the headline concerns capacity, identify the stage: proposed, contracted, energized, installed, available, or revenue-producing. If it concerns performance, identify the workload, precision, latency target, and full system used in the comparison. If it concerns efficiency, ask what the metric includes and what useful work was delivered.
If the headline concerns power, distinguish supply contracts from physical delivery, and capacity from annual energy. If it concerns cooling, follow the heat all the way outdoors and identify the water boundary. If it concerns a customer contract, inspect the duration, delivery obligations, payment structure, and customer’s ability to pay.
If the headline concerns a financial opportunity, identify who earns the revenue, who carries the capital cost, who bears the risk of delay or underuse, and who owns the equipment when the contract ends. A supplier’s strong order growth, a developer’s large pipeline, and a customer’s enthusiastic pilot are different forms of evidence.
The most useful way to understand a data center is as a coordinated operating system made from physical infrastructure, computers, software, and commercial agreements. Each layer creates constraints for the others. Improving one layer can move the bottleneck somewhere else.
That is what makes the space both technically interesting and economically consequential. Progress depends on making the whole operation work: delivering useful computation, reliably, with enough value left over to sustain the next investment.
A short glossary
| Term | Plain-language meaning |
|---|---|
| Accelerator | A processor specialized for particular kinds of computation, such as a GPU or TPU. |
| Bandwidth | How much data a connection or memory system can transfer per unit of time. |
| CDU | Coolant distribution unit; equipment that manages coolant delivery and heat transfer. |
| Checkpoint | Saved computational state that allows work to resume from an earlier point. |
| Colocation | Housing equipment in another operator’s facility and purchasing supporting services. |
| Decode | The generation stage of an autoregressive language-model request. |
| FLOPS | Floating-point operations per second; an arithmetic performance rate. |
| HBM | High-bandwidth memory integrated close to an accelerator. |
| Inference | Running a trained model on new inputs. |
| IT load | The power used by computing, networking, and storage equipment. |
| KV cache | Stored key and value representations used to avoid repeating attention-related work. |
| Latency | Delay, measured across a clearly specified part of a system or request. |
| MW / MWh | Megawatts measure power; megawatt-hours measure energy. |
| NIC | Network interface card; a device connecting a computer to a network. |
| PPA | Power purchase agreement; a contract concerning electricity and potentially environmental attributes. |
| Prefill | Processing a prompt to prepare model state for generating its response. |
| PUE | Total facility energy divided by IT equipment energy over a matching period. |
| RAG | Retrieval-augmented generation; supplying retrieved information to a generation workflow. |
| Scale-up / scale-out | Tight coordination within a system or domain / connecting systems into larger clusters. |
| Token | A unit used to represent input or output, often a fragment of text. |
| Training | Adjusting a model’s parameters through a learning process. |
| UPS | Uninterruptible power supply; supports power quality and temporary continuity of supply. |
Source note: primary sources were initially reviewed September 11–12, 2026; accuracy and references were reviewed again September 13, 2026. All diagrams and numerical examples are original illustrations. Forecasts and historical filings are dated in the text. Vendor materials are used to explain product architecture; performance and economics depend on the complete deployment.