Historical morning edition for October 7, 2026, prepared October 8. Source message timestamp: 04:34:40 PDT, chosen as this reconstruction’s historical information boundary, not an authenticated delivery time or original production cutoff. October 6 is the prior completed US cash session. Market quotations in the selected discussion are not a synchronized live feed.
1. A record-index narrative needs a consistent bond comparison
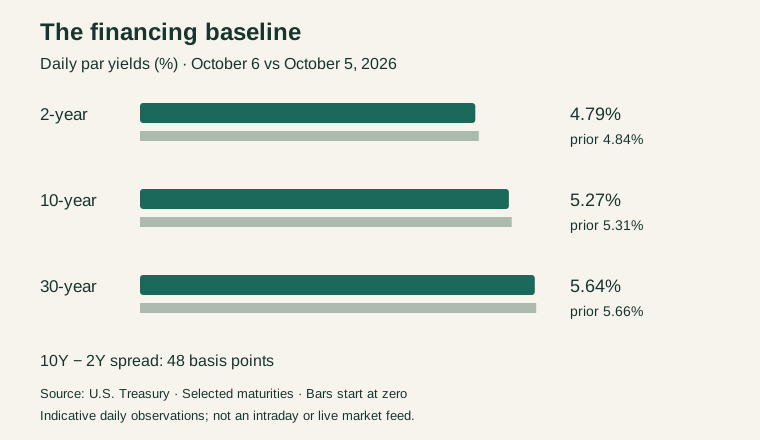
The selected Wednesday packet describes Tuesday record closes for major equity indexes and renewed early pressure from bonds and energy. Its intraday yield peaks should not be confused with official daily observations. On October 6, Treasury's par yields were 4.79% at two years, 5.27% at ten and 5.64% at thirty, all below Monday. The ten-year minus two-year spread nevertheless widened to 48 basis points because the short maturity fell more. Treasury observations
That distinction changes the opening interpretation. The official completed session does not support calling Tuesday an uninterrupted rise in every Treasury maturity. The packet's Wednesday quotations may describe a different time window. Without a matching intraday feed, this edition keeps them as reported context rather than building a false closing-price comparison.
The larger concern survives the correction: long-term rates remain demanding for a capital-intensive investment cycle. Equity enthusiasm can continue, but the return on new projects has to cover financing, depreciation and operating expense. The question is how much of that return is contracted and how much still depends on optimistic utilization.
2. The minutes cannot answer a question from the future
The September meeting record is scheduled for release today at 2 p.m. Eastern, after this early-morning information window. It covers deliberations held before Friday's employment report. Investors can compare that earlier discussion with current data, but it would be chronologically wrong to describe its contents as officials' response to September payrolls released October 2. Fed's October calendar
The September decision raised the target range to 3.75%–4.00%. Since then, the labor and inflation releases have supplied additional evidence for the next meeting. A shift in market expectations is not itself a new policy decision, and different futures probability snapshots cannot be merged without a common observation time. Dated statement
For company analysis, the useful distinction remains short-term funding versus long-term capital. A pause may stabilize a floating-rate expense outlook. It may do much less for a business that must sell long-dated debt or refinance a property at prevailing market yields. The minutes can affect those expectations, but their direction and market impact remain unknown at cutoff.
3. Labor, spending and inflation need to fit one explanation
September's modest payroll gain and downward revisions make it harder to assume that hiring alone will power a broad acceleration in household demand. At the same time, August real consumption rose faster than real disposable income. These are different observation periods and different surveys, so their contrast is a question to investigate rather than a mechanical recession signal. Employment release; BEA release
A benign explanation would combine productivity gains, slower hiring and stable consumer purchasing power. A less favorable explanation would involve households maintaining spending by drawing down financial cushions while companies become more cautious. Earnings reports should help distinguish these paths through unit volumes, customer mix, receivables and management's hiring plans.
Inflation complicates the interpretation because nominal revenue can grow while real activity weakens. Companies with pricing power may protect gross profit temporarily, but customer resistance can appear later. The most useful operating evidence identifies how much revenue growth comes from price, how much from volume and whether collections remain healthy. Aggregate index earnings can conceal large differences across these exposures.
4. A bond auction is a price-discovery event
The source calendar highlights today's ten-year auction as a demand test. This edition is before the event and does not assert its result, stop-out yield or bidder composition. Specific issue details remain an unverified calendar lead here rather than an official announcement reproduced from the Treasury's auction record.
When results become available, the right comparison will be the auction yield against the relevant when-issued market at the bid deadline, together with bidder allocation and subsequent trading. A high absolute yield does not alone mean an auction failed. It may be the price that attracts buyers. A low bid-to-cover ratio also requires context about the security, reopening status and recent comparable auctions.
For equities, the transmission would operate through the cost and availability of capital. If long Treasury borrowing becomes more expensive, a company's all-in yield can rise even with a stable credit spread. If corporate spreads widen as well, refinancing pressure increases further. Those are separate developments, and neither should be inferred from a dramatic social description of a single auction.
5. Energy and foreign bonds can tighten conditions together
The packet's European bond and freight commentary describes a broader concern about financing and supply costs. Exact foreign yield highs and shipping rates are excluded because the original dated series and contract definitions were not reconciled. The useful analytical point is that a US technology company can face risks originating outside the US equity session.
Higher transport costs can raise the delivered cost of energy and equipment even when a benchmark commodity price stabilizes. A weaker customer's currency can reduce purchasing power. Higher foreign bond yields can change relative demand for Treasuries, depending on hedging costs and investor constraints. These channels can reinforce each other without establishing a synchronized global funding crisis.
Company exposure therefore needs to be mapped by revenue location, invoice currency, supply route and financing structure. A domestic power-equipment supplier, a multinational software platform and an importer of refined fuel may react differently to the same news. Broad sector labels lose information when the underlying costs and contracts differ. Verification should follow the actual cash-flow channel being claimed.
6. Scarcity can be real while valuation is still demanding
A prominent selected clip frames the AI risk as insufficient construction rather than a bubble. The idea captures an important distinction: physical shortages and speculative valuations are not mutually exclusive. A necessary component can be scarce while its stock already discounts years of unusually high margins and uninterrupted demand.
For memory, power equipment and cooling, the first questions are capacity, delivery dates and pricing. The next questions are how customers respond to higher prices and how quickly competing supply can arrive. A shortage that raises current earnings may encourage enough investment to erode future margins. A shortage that delays entire projects may also reduce the pace of follow-on equipment orders.
The packet's counts of shortage mentions and per-gigawatt cost estimates are not reproduced as measured facts. They require the original sample, configuration and boundary between IT equipment and facility costs. The investor's task is to connect scarcity to retained cash earnings at the company level, including the working capital and capital expenditure needed to deliver the backlog.
7. The denominator in cost per gigawatt matters
A gigawatt label can describe utility supply, IT load, installed equipment or a future plan. These are not interchangeable. A site that allocates some power to cooling and electrical losses has less available for computing than its total utility draw. A comparison of capital cost per gigawatt is only useful when both the cost boundary and power denominator match.
NVIDIA's 800 VDC roadmap illustrates why electrical architecture belongs in the economics. Reducing conversion losses and conductor requirements can improve a design, but the benefit depends on implementation, equipment and operating conditions. The published roadmap does not verify the cost or completion date of a specific campus. Technical source
For developers, a higher initial equipment bill might be justified by faster commissioning or lower operating costs. Conversely, a cheaper shell can be a poor bargain if it cannot obtain power when needed. Project returns should therefore be assessed over the full service life, with explicit assumptions for utilization, maintenance, refresh cycles and the timing of revenue commencement.
8. Follow the invoice through the supply chain
Micron's fiscal results provide a company-specific basis for the memory discussion: the September 30 release reported $54.23 billion of fourth-quarter revenue. That is stronger evidence of realized business than a social forecast of total industry spending. It still does not prove the end customer's complete project earns an acceptable return. Issuer results
A component supplier can recognize revenue before the operator commissions the full system. The operator must then recover equipment cost, financing, energy, labor and maintenance from customer payments. If the downstream buyer is also dependent on fresh financing, the system's strong near-term sales can coexist with concentrated credit exposure.
For MU, NVDA, AVGO and networking suppliers, monitor customer acceptance, receivables, repeat purchasing and the terms attached to future commitments. For ORCL, CRWV and NBIS, monitor the portion of capacity producing billable service and the duration of contracted revenues relative to debt and equipment life. The distinction improves the analysis without presuming that every financing relationship is circular or uneconomic.
9. The mathematics release is important within its actual scope
OpenAI's October 6 announcement describes mathematical results from an internal frontier model, consultation with an independent Institute for Advanced Study advisory group, and a repository with revision and citation protocols. It does not name the system as a publicly available GPT product or establish that all results received blanket external certification. OpenAI research release
The scientific value will depend on whether the results withstand specialist examination and how useful the methods prove in further work. A revision process is therefore part of the evidence rather than an embarrassment to hide. It creates a route for corrections, clarification and independent scrutiny.
For investors, the near-term implication is a broader set of potentially valuable research tasks. The longer-term possibility is assistance with algorithms and engineering, but that remains a conditional path. Mathematical capability does not automatically yield profitable commercial deployment, autonomous improvement of the entire training process or a break in widely used cryptography. Each stronger claim requires its own demonstration rather than inheritance from the announcement.
10. Fast output has value only inside the whole workflow
The packet pairs wafer-scale inference claims with reports about fast GPU-based services. The underlying hardware-performance comparisons and deployment arrangements are not independently established in this briefing, so exact speed multiples and capacity totals are omitted. Latency remains an important research topic because it can change what customers are willing to delegate.
For an interactive task, faster output can reduce waiting and make a product feel more useful. For a long autonomous workflow, the bottleneck may instead be tool execution, data retrieval, sequential reasoning or human approval. A high tokens-per-second figure measured on one model does not establish the fastest completion of a different task.
An economic comparison needs the same workload, quality threshold, concurrency and latency requirement. Hardware utilization and memory requirements also affect the provider's margin. A premium-speed tier could create pricing power if customers save enough time; it could destroy margin if the premium fails to cover reserved capacity and lower batching efficiency. The useful evidence is paid adoption and completed work under representative load.
11. Generous usage can lower seats as it improves loyalty
A selected builder anecdote says fewer subscriptions were needed after usage became more generous. The direct post is not authenticated here, and one customer's account cannot establish provider-wide churn. It does expose a useful business-model tension: a better product can retain a customer while reducing the number of seats or accounts that customer purchases.
Subscription economics should therefore be analyzed through total paid revenue, usage, retention and service cost together. Seat growth alone may mislead when plans change. So can engagement growth if heavy users consume much more compute without paying proportionately more. A bundle can be attractive for customers while requiring the provider to find efficiency elsewhere.
For enterprise software, the same issue arises when agents perform work formerly spread across multiple users. Vendors may shift toward usage or outcome pricing, but that introduces measurement and budgeting questions for customers. Durable value comes from reliable accepted work and integration into actual processes. The effect on revenue must be measured under the specific commercial model rather than assumed from technical capability.
12. The three debates worth preserving from the selection
The saved leads include Global Market Observer's rates discussion, Lark Davis's selected infrastructure clip and bridgemindai's subscription anecdote. Their selection explains which themes this edition investigates. It does not authenticate each quoted claim, rank engagement across X or establish a shared market consensus.
The first debate asks whether high rates are being absorbed by stronger profits or merely tolerated until a funding event exposes the pressure. The second asks whether bottlenecks create durable supplier rents or postpone the very demand needed to finance expansion. The third asks whether better AI products increase spending or allow users to consolidate subscriptions and complete work more cheaply.
These debates are connected through cash generation. The strongest evidence would be customers paying repeatedly for useful service, operators producing adequate returns and suppliers collecting without unusually generous financing. The weakest evidence is a sum of announced commitments that combines different years, overlapping projects and contingent funding. This edition keeps that distinction explicit rather than assigning precision to unsupported aggregate totals.
13. Separate today's events from next week's inflation test
The minutes arrive later today; the source's ten-year-auction watch also lies after the morning boundary. September CPI is scheduled for October 14 at 8:30 a.m. Eastern. The October 27–28 FOMC meeting has no scheduled projections release. None of those future outcomes is imported into this edition. Fed event calendar; BLS release schedule; FOMC schedule
A constructive path would combine acceptable bond demand, contained energy costs and evidence that AI customers are turning capacity into recurring revenue. A mixed path would leave the broad index resilient while refinancing and delivery delays create increasingly different company outcomes. An adverse path would combine a higher funding hurdle with disappointing utilization or weaker household demand.
The indicators that distinguish these paths are concrete: all-in financing cost, commissioned capacity, customer collections, margins after service costs and earnings participation beyond the largest beneficiaries. Scientific advances can improve the long-run opportunity while these near-term constraints remain binding. Wednesday's early assessment should preserve both ideas and wait for evidence before treating a compelling possibility as an achieved financial result.
Sources & reading notes
Historical edition prepared October 8, preserving the dated morning information window; not a live market feed. Primary releases, observations and plans remain distinguished. Selected X links are unauthenticated leads; scenarios are research rather than portfolio instructions.
Daily observations through the prior cash session. Indicative bid-side inputs near 3:30 p.m. Eastern; not transaction prices or an intraday feed.
Calendar schedules September meeting minutes for October 7 at 2 p.m. Eastern; chronology only, not a summary of minutes content.
September 16 quarter-point increase to a 3.75%–4.00% target range.
October 2 initial September estimates and then-published revisions. Later employment revisions are excluded.
September 30 release and annual-update vintage; August observation period.
May 2025 technical roadmap; architecture and prospective benefits do not establish a specific site is operational.
September 30 release for the year ended September 3. Quarterly revenue, annual deposit proceeds and liability balances are distinct.
October 6 report refers to an internal frontier model and a consultation/revision process; it does not identify a public model or demonstrate a cryptographic break.
Selected original-source lead; direct text and engagement unauthenticated. It is not a platform-wide consensus measure.
Selected original-source lead; direct text and engagement unauthenticated. It is not a platform-wide consensus measure.
Selected original-source lead; direct text and engagement unauthenticated. It is not a platform-wide consensus measure.
September CPI is scheduled for October 14 at 8:30 a.m. Eastern. Calendar viewed October 8; published February calendar vintage.
Original dated announcement establishes October 27–28 and December 8–9, 2026. October has no scheduled Summary of Economic Projections.