Weak payroll growth has not delivered a simple easing in financing conditions. Friday's employment report showed limited hiring, while the completed-session Treasury curve still left long yields above 5%. The next test is services demand. At the company level, memory results and cheaper model access sharpen the question of how much AI spending becomes durable customer value and cash flow.
Reconstruction notice: Reconstructed on October 8, 2026 from dated public sources. No original October 5 daily email was recovered. The assumed cutoff is Monday, October 5 at 7:30 a.m. EDT, before the U.S. cash open; October 2 is the prior completed cash session. This is not an original contemporaneous email. The later October 5 services result and same-day announcements without verified pre-cutoff availability are excluded. There is no verified curated-X ranking for this date.
1. Monday inherits a difficult rates-and-demand mix
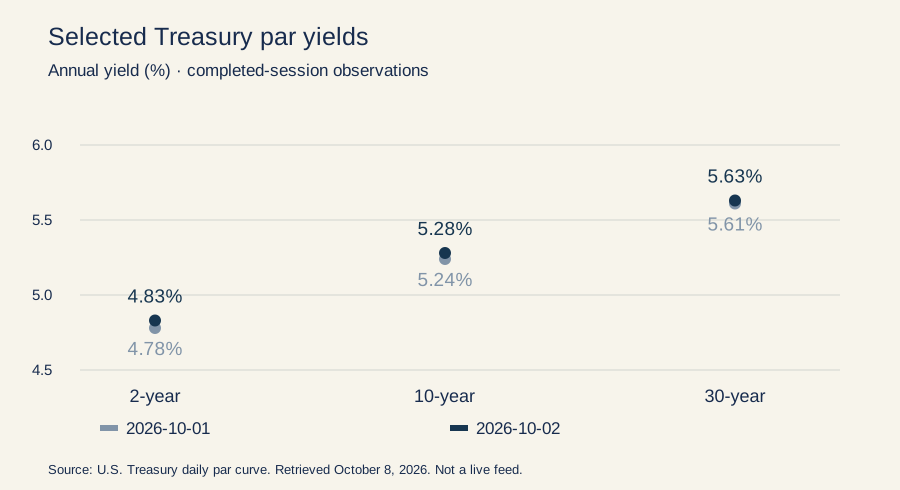
Treasury's October 2 daily par observations were 4.83% at two years, 5.28% at ten years and 5.63% at thirty years. Compared with October 1, the selected yields rose 5, 4 and 2 basis points. The two-to-ten-year spread was 45 basis points. The payroll release preceded these observations, but their ordering alone does not prove that payrolls caused the bond move. Treasury's October table.
This is a completed-session funding baseline, derived from indicative prices near 3:30 p.m. Eastern. It is not Monday's live curve. Exact Friday equity closes, overnight futures, dollar levels and oil settlements have not been independently reconciled into one panel. They are omitted rather than borrowed from later commentary.
The combination still frames the central question: if hiring is subdued but long-term capital remains expensive, which businesses can sustain earnings without relying on an imminent broad decline in borrowing costs?
2. Payrolls show limited hiring, with important revisions
The October 2 BLS release reported September payroll growth of 29,000 and unemployment of 4.2%. Average hourly earnings rose 0.1% in the month. July and August payroll changes were revised down by a combined 60,000. These are September observations released on Friday morning, already available for this Monday reconstruction. No independently verified consensus forecast is used, so the report is not labeled a measured market “miss.” Archived employment report.
Small positive hiring and downward revisions warrant attention because households spend income, not forecasts of future rate relief. At the same time, a single payroll estimate is noisy, and the unemployment rate comes from a separate survey. Those measures should be read together without pretending they are identical counts.
The next question is persistence. Repeated weakness in hiring, hours and wage income would weigh on consumer demand more heavily than one subdued month. Stable employment with improving purchasing power would support a less adverse interpretation. The report opens that comparison; it does not settle the entire cycle.
3. Services is a forward test at this cutoff
ISM's prior release scheduled September services data for October 5 at 10 a.m. Eastern. That is two and a half hours after the assumed morning cutoff. The subsequent headline and component values do not belong in this edition. ISM's advance release notice.
The useful comparison will be among business activity, new orders, employment and prices. If activity holds while hiring softens, firms may be meeting demand with existing staff or productivity gains. If orders weaken as well, the interpretation becomes more concerning for future revenue. Elevated prices alongside softer activity would create a more difficult margin and policy mix.
A diffusion index measures the breadth of reported change. It does not directly measure the percentage growth of output, employment or prices. Consequently, the services employment component cannot replace payroll counts, and the prices component cannot be read as a consumer-inflation rate. Any apparent disagreement should first be checked for measurement differences before being called a contradiction.
4. Inflation and consumption still pull in different directions
BEA's September 30 release reported August PCE inflation of 0.3% month on month and 3.4% year on year. Excluding food and energy, the increases were 0.2% and 3.0%. Real consumption rose 0.6% in August. Those figures provide a demand-and-price baseline available before Monday. They come from the release vintage that incorporated the annual update, rather than an unrevised continuation of the previous monthly series. August income and outlays release.
Solid real spending can support corporate sales even when hiring slows. The durability question depends on income, saving and access to credit. A household can maintain spending temporarily by reducing saving, but that mechanism has different limits from a sustained rise in real earnings.
For margins, the mix also matters. Slower wage growth may ease one cost line while energy, insurance or financing remain expensive. The investment case should therefore identify where cost relief occurs and whether the company retains it or passes it through to customers.
5. A soft labor print does not reset every funding rate
The policy baseline remains the September 16 increase to a 3.75%–4.00% federal-funds target range. The statement emphasized elevated inflation and continued ample reserves. The October 2 employment data arrived afterward. No exact October meeting probability is supplied because a contemporaneous, timestamped pricing snapshot has not been verified. Dated policy statement.
Long yields incorporate more than the next overnight-rate decision. Expected future short rates, compensation for duration risk and other market conditions can offset each other. Private borrowers then pay an additional spread determined by their own credit and contract terms. A policy-easing narrative may therefore coexist with a difficult refinancing environment.
The dollar adds another channel. Appreciation can pressure foreign revenue translated into dollars and unhedged dollar liabilities; depreciation can shift those effects in the opposite direction. Neither direction is asserted for Monday without dated FX evidence. The research priority is the actual financing and earnings exposure, rather than an assumed all-purpose liquidity signal.
6. Slower hiring changes the sector questions
Consumer-facing companies need evidence on traffic, ticket size, credit use and delinquency before a softer labor report can be translated into an earnings revision. Lower wage pressure may help labor-intensive operators, but that benefit can be overwhelmed if customers postpone discretionary purchases. The balance differs between essential services and items that can wait.
Housing and property remain sensitive to affordability and refinancing. Utilities and infrastructure developers need returns that cover long-lived financing commitments. Large platforms with internal cash generation have more room to absorb a delayed monetization cycle, although their share valuations can still respond to higher discount rates.
Energy producers and refiners also require separate treatment. The former depend on realized commodity prices and volumes; the latter depend on product spreads and operating conditions. There is no verified Monday oil-price panel here. The point is to map the exposure that needs checking, rather than invent sector performance or assume that weaker payrolls benefit every rate-sensitive business equally.
7. Micron supplies a concrete corporate demand observation
Micron's September 30 release reported fiscal fourth-quarter revenue of $54.23 billion and operating cash flow of $43.97 billion. The quarter ended September 3, so those financial results have a different observation period from September payrolls or Monday's market session. They substantiate substantial realized business at this supplier, without directly measuring returns earned by its customers. Micron fiscal results.
The analytical task is to separate price, volume and mix. Scarce, qualified memory can command attractive economics while other categories follow different cycles. A headline result alone cannot show how much of the margin is durable after capacity additions, customer negotiations and technological transitions.
That is also why supplier strength and customer strain can coexist. A customer may accept expensive components to meet delivery obligations before its own services generate sufficient revenue. The next company checks should connect shipments to collections, future supply commitments and the spending required to sustain the product mix.
8. Customer deposits improve funding but carry obligations
The same Micron statements show $12.747 billion of customer contract-liability deposit proceeds for the fiscal year and $12.895 billion of noncurrent customer contract liabilities at September 3. A yearly cash-flow item and a point-in-time liability balance are different measures. Neither should be described as deposits received in the quarter or merged with a multiyear agreement headline.
Economically, advance customer funding can reduce a supplier's need to raise external capital. It can also signal customers' willingness to secure future supply. The offset is an obligation to perform under the arrangement. Cash received before delivery is not automatically free profit available without future cost.
The useful questions concern refund conditions, delivery schedules, pricing protection and capacity commitments. Those terms determine who absorbs a change in demand or manufacturing cost. Where the terms have not been checked, the interpretation should remain bounded. The verified accounting already gives a cleaner picture than combining commitments, deposits and revenue into one impressive but misleading demand total.
9. Cheaper model access changes the workload calculation
OpenAI's September 29 DevDay recap and GPT-6.1 Sol launch establish the new model before this Monday window. The launch quotes standard API prices of $2 per million input tokens, $10 per million output tokens and $0.10 per million cached input tokens. Vendor capability comparisons remain vendor evaluations, rather than a universal ranking of production performance. DevDay recap; Sol launch and pricing.
An illustrative workload with one million uncached input tokens and 100,000 output tokens costs $3 at those rates, before tools, retries or other charges. If the same input qualifies entirely for cached pricing, that arithmetic becomes $1.10. The example demonstrates the importance of token mix; it is not a representative customer bill.
Lower unit prices can encourage more experiments and make previously marginal tasks economical. Total spending can still rise if users run longer or more numerous workflows. For investors, the next test is accepted work, repeat paid usage and retained margin after the full cost of serving it.
10. Frontier capability and customer access are separate
Google announced Gemini 4 Argon on September 30, initially rolling it out to trusted cyber defenders through Fairwind while describing a phased path to broader availability. By October 5 the announcement was already public. Calling the model an unannounced future release would misstate that chronology, while treating the announcement as universal customer access would overstate availability. Google's Argon announcement.
That distinction has commercial consequences. A model's demonstrated capabilities influence competitive expectations, but enterprise adoption also requires access, predictable service, integration and controls. The time between a demonstration and a repeatable production workflow can matter as much as a benchmark lead.
The research should compare similar tasks, effort settings and acceptance criteria. A more capable system may justify a higher cost when it avoids expensive errors; a cheaper system may win routine work. The opportunity for routing across models depends on the distribution of actual customer tasks, not a single score that supposedly describes every workload.
11. Infrastructure value depends on the customer's workload
The model-price changes create two plausible forces. More useful work per dollar can expand demand for inference and surrounding infrastructure. More efficient execution can reduce the resources needed for a given task. The net effect depends on how much usage expands, which workloads customers retain and whether the provider captures enough value to fund capacity.
Akamai's September 24 Anthropic CPU-services agreement is an existing example of demand outside accelerators. Its $11.6 billion commitment, potential expansion and associated capital expenditure should retain their separate definitions and timing. Akamai announcement. The broader question is how model execution connects to storage, orchestration, networking and usable power.
For an operator, the chain runs from funds available to equipment installed, service accepted and revenue collected. For an equipment supplier, orders may become cash earlier. A buildout can therefore produce strong reported supplier results while leaving the ultimate return on some projects unresolved. Those different clocks deserve separate company models.
12. Keep the missing social record missing
There is no recovered October 5 daily email and no verified curated-X ranking. The analysis here selects themes supported by dated public releases. It does not claim that these were the most popular posts, the dominant market consensus or the precise questions selected in an unavailable original briefing.
The October 5 services results are intentionally withheld because their release follows the assumed cutoff. Same-day advertising and provenance announcements are also excluded where their availability before 7:30 a.m. cannot be established. A later recap may be useful for another edition, but it cannot silently become this morning's information set.
These limits leave a coherent research agenda: assess whether softer hiring spreads to demand, whether inflation permits easier finance, and whether stronger AI capability improves customer economics. Each proposition can be investigated with subsequent evidence. Keeping the boundary visible prevents hindsight from making the original decision environment look easier than it was.
13. This week's calendar is not next week's inflation report
Services arrives Monday at 10 a.m. Eastern. The Federal Reserve calendar places the release of the September 15–16 meeting minutes on October 7. Those minutes concern a meeting held before October 2 payrolls; they cannot reveal policymakers' contemporaneous response to data that had not yet been published. The calendar readback was checked October 8, and no minutes content is imported here. Federal Reserve calendar.
September CPI is scheduled for October 14 at 8:30 a.m. Eastern, in the following week. The next regular FOMC meeting is October 27–28, followed by December 8–9. October is not a scheduled projections meeting. BLS October schedule.
The immediate task is to compare new activity evidence with the existing inflation baseline. Calendar precision matters: anticipating a release in the wrong week can distort the intended observation window and encourage a narrative built around a catalyst that is not actually imminent.
14. The useful scenarios connect demand to cash
Orderly adjustment: hiring stabilizes, services demand remains healthy and inflation pressure eases. Company results then show usable capacity generating repeat revenue. This would support an earnings case alongside the prospect of less restrictive finance, rather than relying exclusively on lower discount rates.
Selective resilience: demand remains sufficient to support scarce suppliers, but long yields and project costs stay high. Cash-rich platforms and well-funded operators could fare differently from businesses with uncertain activation schedules. The research should discriminate by obligations, funding duration and customer economics.
Demand and funding stress: weaker employment spreads to orders while financing remains expensive. That would challenge both cyclical revenue and the willingness to fund distant AI returns. Customer deposits and large contracts may cushion the immediate cash requirement without removing performance obligations.
The interpretation should change with actual orders, utilization, collections and financing terms. A favorable product launch or one soft employment report cannot stand in for that complete evidence chain. The central test is whether useful work produces enough durable cash to support the investment behind it.
Sources & reading notes
Historical reconstruction prepared October 8, 2026 with an assumed 7:30 a.m. EDT cutoff on the coverage date; not a live market feed. No original daily email or verified curated-X ranking was recovered. Dated primary releases are distinguished from analysis; later outcomes are excluded. Treasury historical rows were retrieved October 8 and are not immutable contemporaneous captures. Research scenarios are not portfolio instructions.
Selected daily par yields near 3:30 p.m. Eastern; historical rows retrieved October 8, not immutable original-day captures.
September payrolls +29,000, unemployment 4.2%, hourly earnings +0.1% monthly, combined July/August revisions -60,000.
Prior August services page schedules September release October 5 at 10 a.m. Eastern. Only the advance schedule is used; later outcome excluded.
Headline PCE +0.3% monthly/+3.4% yearly; core +0.2%/+3.0%; real PCE +0.6%. Annual-update vintage.
Target range increased by a quarter point to 3.75%–4.00%; does not establish future market odds.
Quarter ended September 3: $54.23 billion revenue and $43.97 billion operating cash flow. $12.747 billion deposit proceeds are full-year cash flow; $12.895 billion is a noncurrent liability balance.
Dated recap establishes Sol launch before the October 5 window.
Standard API dollars per million tokens: input 2, output 10, cached input 0.10. Workload examples are illustrative arithmetic excluding additional costs.
Initial trusted-defender access via Fairwind and phased wider availability; vendor claims do not prove universal production performance.
Commercial commitments, optional expansion and capital expenditure have separate timing and definitions.
Retrospective schedule check only: October 7 minutes refer to September 15–16 meeting; October 27–28 and December 8–9 meetings. No later minutes contents used.
September CPI scheduled October 14 at 8:30 a.m. Eastern, in the following week.
Page last-update stamp June 24, 2025. Lists September meeting minutes for October 7 at 2 p.m. Eastern and the October 27–28 meeting; no minutes content is used.