Information window: Tuesday, September 22 cash trading and early Wednesday commentary available in the source received September 23 at 05:55:26 Pacific. This edition precedes Wednesday’s US flash PMI and cash session. Evidence key: V = checked primary disclosure; R = source-reported market observation; X = attributed social commentary; A = analysis. Figures from different sessions are not a synchronized live snapshot.
A record with an uneven foundation
R. The source describes another Nasdaq record on Tuesday, while the S&P 500 was essentially flat and the Dow fell. That combination matters more than the record alone: large technology companies can carry capitalization-weighted benchmarks while banks, industrials and consumer companies weaken. The question for Wednesday is whether leadership broadens as energy pressure eases, or whether expensive capital keeps most businesses outside the advance.
| Tuesday, September 22 | Reported observation | Interpretation to test |
|---|---|---|
| Nasdaq Composite | About +0.45% to +0.5%, near 27,244 | Technology leadership persisted. |
| S&P 500 | Roughly unchanged near 7,764–7,765 | Technology gains were offset elsewhere. |
| Dow | About −0.36% to −0.4%, near 51,864 | The advance was not uniform. |
The Nasdaq 100 and Nasdaq Composite are different indexes. Tuesday’s returns also should not be blended with Monday’s larger semiconductor rebound or weekly stock-performance figures.
Breadth: a useful warning with a missing denominator
X. The curated discussion attributes the narrow-market argument to Arthur Vandelay: new Nasdaq highs alongside weak participation and a divergence between technology/communications and consumer/industrial groups. Its striking “23% above the 40-day average” figure lacks a defined universe and independently reproduced calculation here. It is a research lead, not a verified all-market statistic.
A. A stronger test would align the index with its own constituents, compare equal-weight and capitalization-weighted performance, and track advances, declines and new lows over the same session. Financial-sector weakness could reflect funding pressure, lending expectations or positioning; one negative session does not identify the cause. A record accompanied by improving participation would weaken the concentration concern. Continued deterioration outside a handful of leaders would strengthen it, even if the headline index stayed firm.
Rates: use a dated curve, then evaluate the new quotes
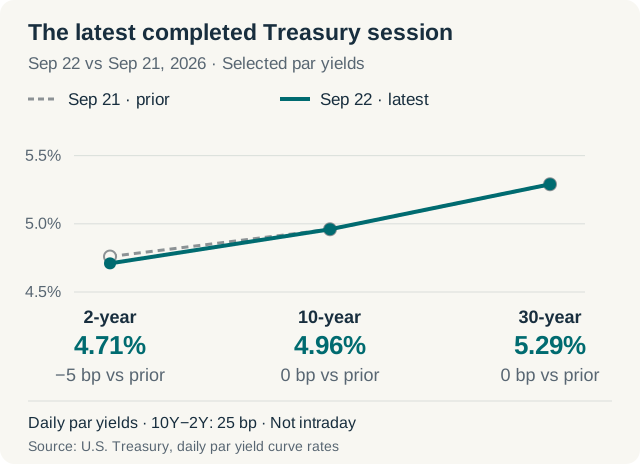
V. Treasury’s September 22 daily par series records a 4.71% two-year yield and 4.96% ten-year yield, a 25-basis-point spread. These are standardized daily observations. R/X. Early Wednesday commentary linked to ZeroHedge reports the two-year near 4.79%; it is a later, differently timestamped quote. It cannot be combined with Tuesday’s ten-year to manufacture a Wednesday curve. Treasury data and methodology.
V/A. The Fed had raised its target range to 3.75–4.00% on September 16. Higher front-end yields would signal less near-term policy relief; higher long yields also increase the discount applied to distant profits. Neither observation proves that recession is imminent or that another hike is certain. The transmission differs between a cash-rich platform and a company refinancing construction debt. September 16 decision.
Energy relief has to survive the inflation test
V. August CPI, released September 11, rose 0.4% month over month and 3.4% year over year; core rose 0.3% and 2.4%, respectively. These are already-known data, not Wednesday news. BLS August CPI release.
R/A. The source’s oil quotations mix contracts and observation times, so a single spot price would suggest false precision. Its consistent theme is relief around shipping and supply expectations, offset by continued fuel-cost pressure. Lower crude can ease transport and household costs, but sustained disinflation requires more than a diplomatic headline. Refined-product prices, freight costs and business pricing plans provide the next checks.
The reported firmer dollar also matters: it can restrain dollar commodity prices while reducing translated overseas revenue. Gold weakness alongside a stronger dollar and higher yields would be consistent with a rate-sensitive repricing; it would not by itself show that geopolitical risk had disappeared.
AI’s near-term bottleneck is usable capacity
X. The Manning Capital lead emphasizes smaller sites that can be energized sooner, while Rocket Terminal’s discussion frames power availability as an economic constraint. Their large shortage and dollar-per-watt estimates are not independently established here.
A. The underlying distinction is concrete: a planned campus, a signed interconnection agreement, an energized building and an accepted customer cluster are different milestones. Revenue generally depends on reaching the later stages. A smaller operating site can earn earlier cash flow, but scattered sites may add networking, staffing and operational costs or fail a large training job’s topology requirements. For CoreWeave, Nebius and IREN, the research question is contracted capacity delivered on schedule, customer acceptance and the financing carried during delays—not a comparison of announced megawatts alone.
NVIDIA’s DSX announcement makes the supplier discussion specific
V. NVIDIA launched DSX Ready on September 21 with battery-storage and cooling-distribution-unit qualification. Named initial suppliers include Hitachi Energy, LG Energy Solution and Tesla for storage, and LG Electronics, LiquidStack and Vertiv for cooling. Qualification addresses product requirements; it does not certify an entire site’s stability. NVIDIA announcement.
A. This is a route from reference design to supplier selection, not a disclosed purchase order. For Vertiv, the next evidence is design selection converting to shipments, service revenue and cash collection. Batteries can buffer load changes and provide stored energy for limited periods; they do not replace continuous generation. Cooling must work across the chip, rack and facility. A qualified component therefore reduces one integration uncertainty while leaving construction, water, maintenance and power-delivery questions open.
Memory: distinguish scarcity from earnings already delivered
R/A. Micron’s reported Tuesday strength put memory back in the leadership discussion. A share-price move does not establish a new order or a new earnings result. HBM, conventional DRAM and NAND serve different needs, and supply cannot be treated as instantly interchangeable across products, packaging and customer qualifications.
For Micron, useful questions concern qualified HBM output, contract pricing, yield, conventional-memory supply and cash invested to expand capacity. For NVIDIA, AMD and custom-accelerator buyers, more memory bandwidth can help useful throughput, but memory cost and availability also affect system cost and delivery. A bottleneck can strengthen a component supplier’s pricing while weakening a cloud operator’s economics.
V. Micron’s next results call was scheduled for September 30 at 4:30 p.m. Eastern. It remained a future catalyst in this edition. August 26 scheduling announcement.
Networking: the optical thesis needs system-level evidence
X/V. The source links Zhang’s interconnect discussion to growing data-movement and power costs. There is a concrete company roadmap behind the theme: TSMC’s 2026 technology-symposium announcement planned COUPE-on-substrate optical integration for production during 2026. That statement verifies a roadmap, not every deployment forecast circulating on X. TSMC announcement.
A. Moving optics closer to a switch or compute package may reduce electrical reach and associated power. The investment test must include lasers, cooling, packaging yield, repairability and utilization. Component efficiency is not automatically the same saving at the wall plug. NVIDIA, Broadcom, Marvell and TSMC have different exposure to switches, connectivity silicon, custom compute and manufacturing. Qualification wins and shipment mix are better checkpoints than assigning the entire optical market to every company.
Idle chips and rising rents can coexist
X. The source contrasts an idle-equipment critique associated with Dean Baker amplifying Ed Zitron with Ozak AI’s discussion of useful life and reported older-GPU rental resilience. Neither is a verified industry utilization dataset.
A. Both observations could coexist. An unpowered cluster in one region is not a substitute for an operating cluster with the required network, software and contract terms elsewhere. Rental advertisements also differ from realized prices and paid occupancy. The operating bridge should run from installed capacity to available capacity, billable hours and collected revenue.
Reliability belongs in that bridge. Failed jobs, checkpoint overhead and recovery time consume resources without necessarily producing billable output. Cluster scale therefore needs to be evaluated alongside completed-work throughput and service credits. Anecdotes about one training cluster cannot establish a universal failure rate.
Useful life is an accounting estimate; cash recovery is a test
V. In its January 28 FY2026 second-quarter call, Microsoft explained that higher memory prices affect capital expenditure before their full margin effect appears through depreciation over six years. This is historical issuer context, not a new September accounting change. Microsoft transcript.
A. Extending an asset’s assumed life can lower annual depreciation without improving cash receipts. Equally, older hardware can remain economical for workloads that do not require the newest accelerator. The decisive evidence is cohort-level cash generation after power, service and financing costs, plus utilization as newer chips arrive. Compare capex, operating cash flow, depreciation and impairments separately. A social estimate of “EPS inflated by several percent” cannot substitute for the company’s asset balances and accounting-policy disclosures.
Agents move the question from tokens to completed work
A. The source’s model and developer-tool roundup is useful for identifying research areas, but several release and benchmark claims lack checked primary announcements. The stronger economic question is whether agents complete valuable tasks reliably enough to justify their total cost.
An agent can call a model repeatedly, retrieve documents, run code and use external tools. Cheaper individual tokens need not produce a cheaper finished task if retries or human review increase. Software vendors need to demonstrate paid adoption, retention and gross margin after inference costs. Customers need measurements against the prior workflow: completion rate, elapsed time, error correction and human effort.
Security expands with tool permissions and data access. Identity controls, least-privilege authorization, audit trails and protection from malicious retrieved instructions become product requirements. That creates a research avenue for Microsoft and security vendors, but incremental security spending and durable vendor advantage still require evidence.
Company checkpoints that connect the themes
| Exposure | What could improve | Evidence that could weaken the case |
|---|---|---|
| NVIDIA / Broadcom / Marvell | System and connectivity demand converts to delivered revenue. | Customer delays, qualification slippage or a less profitable mix. |
| Micron / TSMC | Qualified output and advanced packaging support shipments. | Yield limits, customer concentration or spending ahead of cash returns. |
| Vertiv / power suppliers | Approved designs become installed equipment and services. | Project deferrals, execution costs or weak cash conversion. |
| CoreWeave / Nebius / IREN | Powered, accepted capacity earns contracted revenue. | Delivery delays, funding costs or insufficient utilization. |
| Microsoft / application vendors | Useful agent adoption creates profitable recurring usage. | High inference expense, weak retention or costly human supervision. |
The next dated tests
A. Wednesday’s US flash PMI is still ahead of this source window. The informative combination is activity, employment and prices: stronger activity with easing costs supports a different interpretation from stronger activity with renewed pricing pressure. Thursday’s labor update provides another check on resilience. Micron’s September 30 call can test memory supply, pricing and spending assumptions.
The BEA calendar lists the third estimate of second-quarter GDP and August personal income/outlays for September 30 at 8:30 a.m. Eastern. That is the calendar checked for this historical reconstruction; no later release results are used. BEA schedule.
What would change the interpretation
A. A constructive expansion would combine steadier energy prices and yields with improving participation and evidence that AI capacity is becoming productive. A concentration problem would persist if the index remained strong while equal-weight performance, banks and consumer-sensitive groups deteriorated. A financing problem would become more convincing if higher yields coincided with project delays, tighter borrowing terms or weaker cash conversion. These are conditional tests, not market forecasts.
Source limits. The X links preserve leads curated in the dated source; direct post reads were unavailable, so their content, authorship and engagement have not been independently authenticated. They demonstrate the arguments collected for this edition, not measured platform-wide consensus. Market quotations and breadth claims marked R or X remain attributed. Primary disclosures verify only the facts specifically attached to them. This is dated research, not a live market feed.
Sources & reading notes
Historical synthesis of complete dated source packets and linked primary disclosures; not a live market feed. V denotes a specifically verified primary fact; R a source-reported market observation; X a source-curated social lead whose content was not independently authenticated; A editorial analysis. Receipt time establishes source availability, not a synchronized quotation cutoff. No later market outcomes are introduced.
Direct post access was unavailable. Content, authorship and engagement are not independently authenticated; snowflake time alone is not authentication.
Direct post access was unavailable. Content, authorship and engagement are not independently authenticated; snowflake time alone is not authentication.
Only prior-session daily par observations used; intraday quotes are separate.
Verified target range after the September 16 decision, before either edition.
September 11 release; historical background within both information windows.
Direct post access was unavailable. Content, authorship and engagement are not independently authenticated; snowflake time alone is not authentication.
Direct post access was unavailable. Content, authorship and engagement are not independently authenticated; snowflake time alone is not authentication.
Verified announcement and named qualification categories; not orders or site certification.
September 30, 2026 results call at 2:30 p.m. Mountain / 4:30 p.m. Eastern remained future.
Direct post access was unavailable. Content, authorship and engagement are not independently authenticated; snowflake time alone is not authentication.
Company COUPE-on-substrate production roadmap; not proof of every commercial deployment.
Direct post access was unavailable. Content, authorship and engagement are not independently authenticated; snowflake time alone is not authentication.
Direct post access was unavailable. Content, authorship and engagement are not independently authenticated; snowflake time alone is not authentication.
Historical management explanation of memory-capex and six-year depreciation timing.
September 30 schedule checked during reconstruction; not an archived historical calendar capture.