Information window: Monday’s macro source was received at 4:32:46 a.m. Pacific. The contemporaneous research also used approximately 6:00–6:14 a.m. Pacific morning observations. Those later indications remain separate from the early packet and Friday’s cash close.
Monday’s research opens with renewed concern about oil supply and a debate about how quickly AI investment will grow. The early source describes weaker technology futures after Friday’s rebound. The later-morning research adds a more specific distinction between chip suppliers and application software. Together they identify a question about business models, not proof that all technology demand changed overnight.
This historical edition combines separately timed research windows. Market-price observations and social explanations remain source-reported. The dated BLS release is independently checked below; a complete source text does not itself verify every claim.
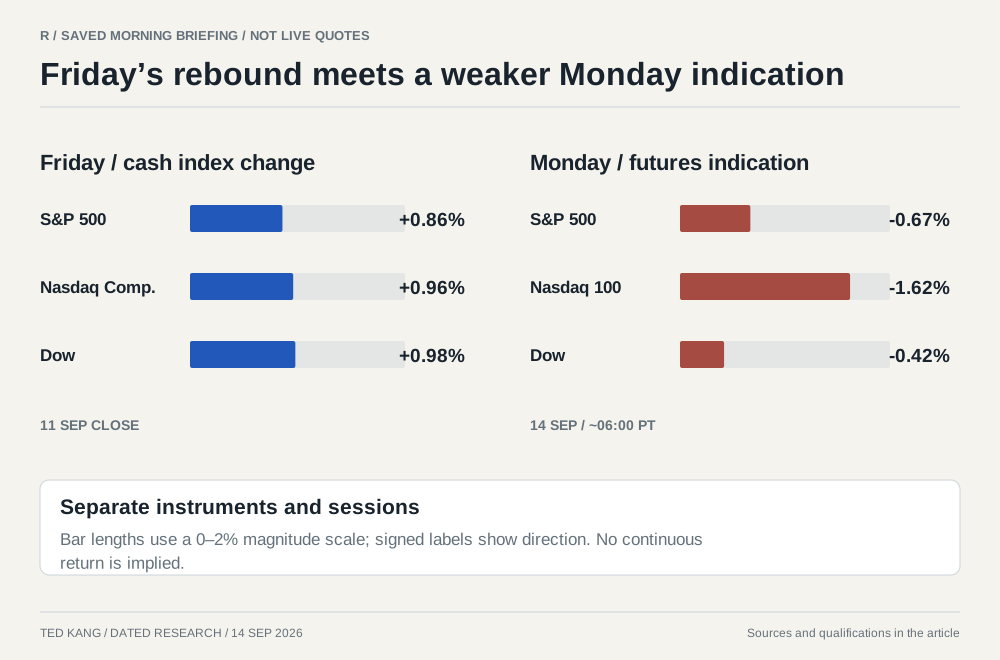
What changed from Friday
The packet attributes Monday’s pressure to renewed pipeline and shipping concerns, higher financing costs, and discussion about slowing frontier-model development. Those explanations need separate evidence. A futures decline does not verify a physical outage, a change in policy, or canceled infrastructure orders.
The source contains a date error: it calls the Friday cash session “12 Sep.” Friday was September 11. The two-session diagram uses the corrected date. Cash Nasdaq Composite returns remain distinct from Nasdaq-100 futures; they are different instruments and do not form one continuous series.
Follow the energy shock into company economics
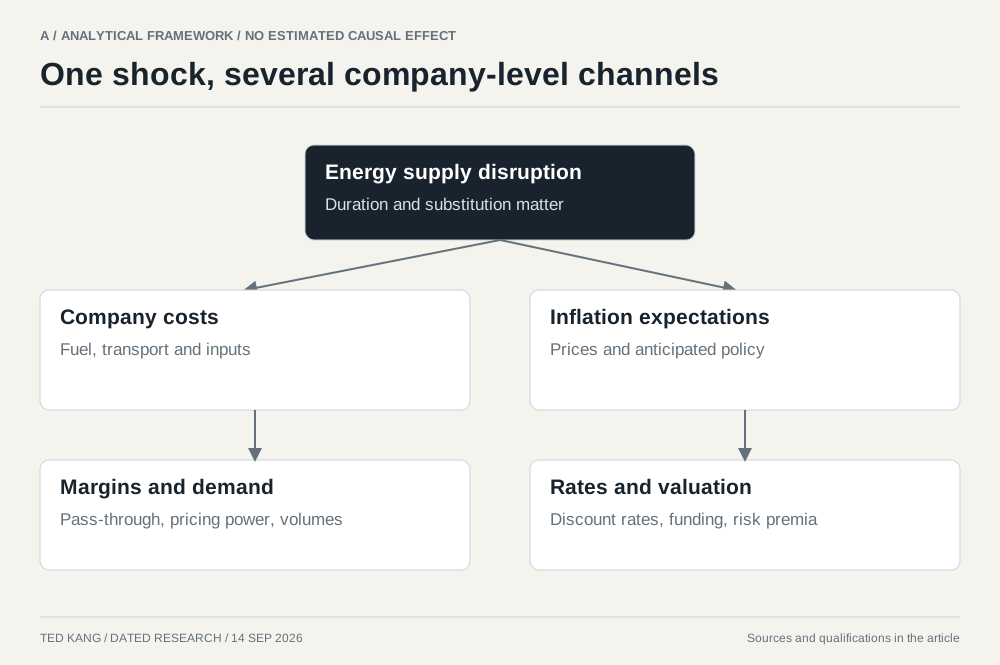
If an energy disruption persists, the effect reaches businesses through realized selling prices, fuel bills, freight, customer purchasing power, and the cost of capital. Producers, refiners, oilfield services, and fuel consumers face different exposures.
For producers such as Exxon Mobil and Chevron, examine output, realized pricing, costs, and hedges. For refiners, examine product spreads and feedstock availability. For transport businesses, examine fuel contracts, surcharges, and the timing of cost recovery. Naming a potential beneficiary is the start of the analysis.
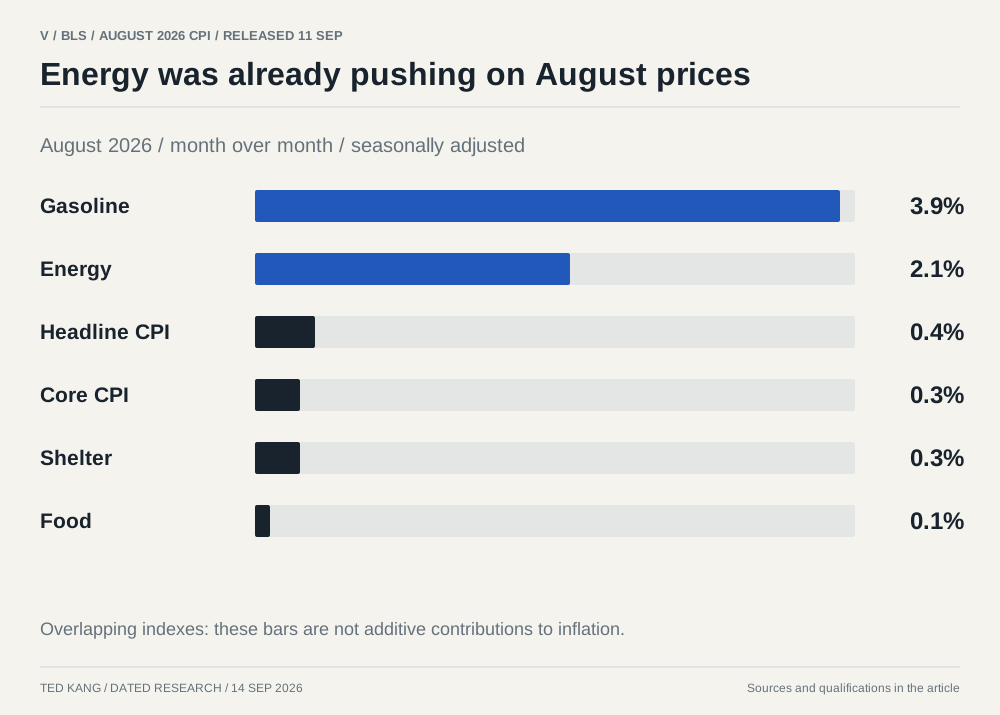
The transmission diagram is a conceptual guide: its arrows describe conditional channels rather than an estimated causal model. The dated September 11 BLS release confirms August headline CPI of 0.4% month over month, seasonally adjusted, and 3.4% over twelve months, not seasonally adjusted; core rose 0.3% and 2.4%, respectively. The category chart also matches the archived release: gasoline rose 3.9%, energy 2.1%, shelter 0.3%, and food 0.1% over the month. These are overlapping indexes, not additive contributions.
The AI split is about who bears the cost
The early social packet favors physical infrastructure while expressing concern about frontier-model pacing. The later saved research describes chip weakness alongside software strength. That tension should remain visible. A short-term market reaction and a durable change in infrastructure demand are different claims.
Dell, Oracle, and Adobe provide three research questions. For Dell, how do AI-server orders become deliveries, margins, and cash? For Oracle, who finances infrastructure before contractual demand becomes profitable revenue? For Adobe, does AI increase paid adoption and retention enough to cover its operating cost?
Backlog, remaining performance obligations, recognized revenue, operating cash flow, and adjusted free cash flow are not interchangeable. Their definitions and reconciliations matter. Company financial figures require period-specific definitions and reconciliations; this edition does not combine unlike measures into a numerical comparison.
What would change the interpretation
A better setup would combine more reliable energy supply, stable financing conditions, and broader participation supported by company evidence. Persistent dispersion with orderly credit would favor continued company-by-company research. Weakness spreading into previously resilient software alongside deteriorating credit would raise a broader question about financing and earnings.
The source calendar places the Fed decision later that week and highlights retail sales and further central-bank communication. These events were still ahead at the original cutoff; their outcomes appear in later dated editions.
Source trail
The packet preserves JVL’s Monday setup, nektrades on oil during Fed week, and petrowashere’s infrastructure discussion. These links establish provenance, not independent verification of the claims.
The session diagram preserves reported observations with their original instruments and timestamps. The inflation diagram uses the archived BLS release. The energy-transmission diagram explains conditional economic relationships.
Sources & reading notes
Historical synthesis of dated market research; not a live market feed. Specifically linked primary-source checks are distinguished from reported market observations and social commentary. Research questions and conditional scenarios are editorial analysis. Original session dates and information windows are preserved.
Specifically cited facts were checked against this primary source. The original release and observation dates remain applicable.
Original-post URL preserved from source; content and claims not independently authenticated.
Original-post URL preserved from source; content and claims not independently authenticated.
Original-post URL preserved from source; content and claims not independently authenticated.