
1. Introduction
The most dangerous thing in crypto right now is the idea that $60,000 is the floor. It is not a floor. It is a trapdoor.
Bitcoin is following the midterm year script almost perfectly. Every post-halving cycle produces the same sequence: a top in Q4 of the halving year, a bear market the year after, and a slow grind toward capitulation that takes far longer than anyone expects. 2014. 2018. 2022. Now 2026. The pattern is not subtle. It is the most well-documented rhythm in crypto. And yet most of the market is still trading as if this time is different.
2. The 2014 Analog
Of the three prior midterm years, 2026 is tracking 2014 most closely on a year-to-date return basis. That matters because each analog implies a different bottoming timeline. The 2014 script played out as follows: a February low, a dead cat bounce in March, a secondary breakdown in April, and a final capitulation that did not arrive until October.
If that analog holds, we are currently in the March bounce phase. The rally into early March that peaked near $73,500 and subsequently faded fits the template. The next window of weakness falls between days 82 and 90 of the year, which puts us right at the edge of an April breakdown.
"I think that is exactly what happens next."
Midterm Year Overlay
YTD Return (%) · 2014 / 2018 / 2022 / 2026
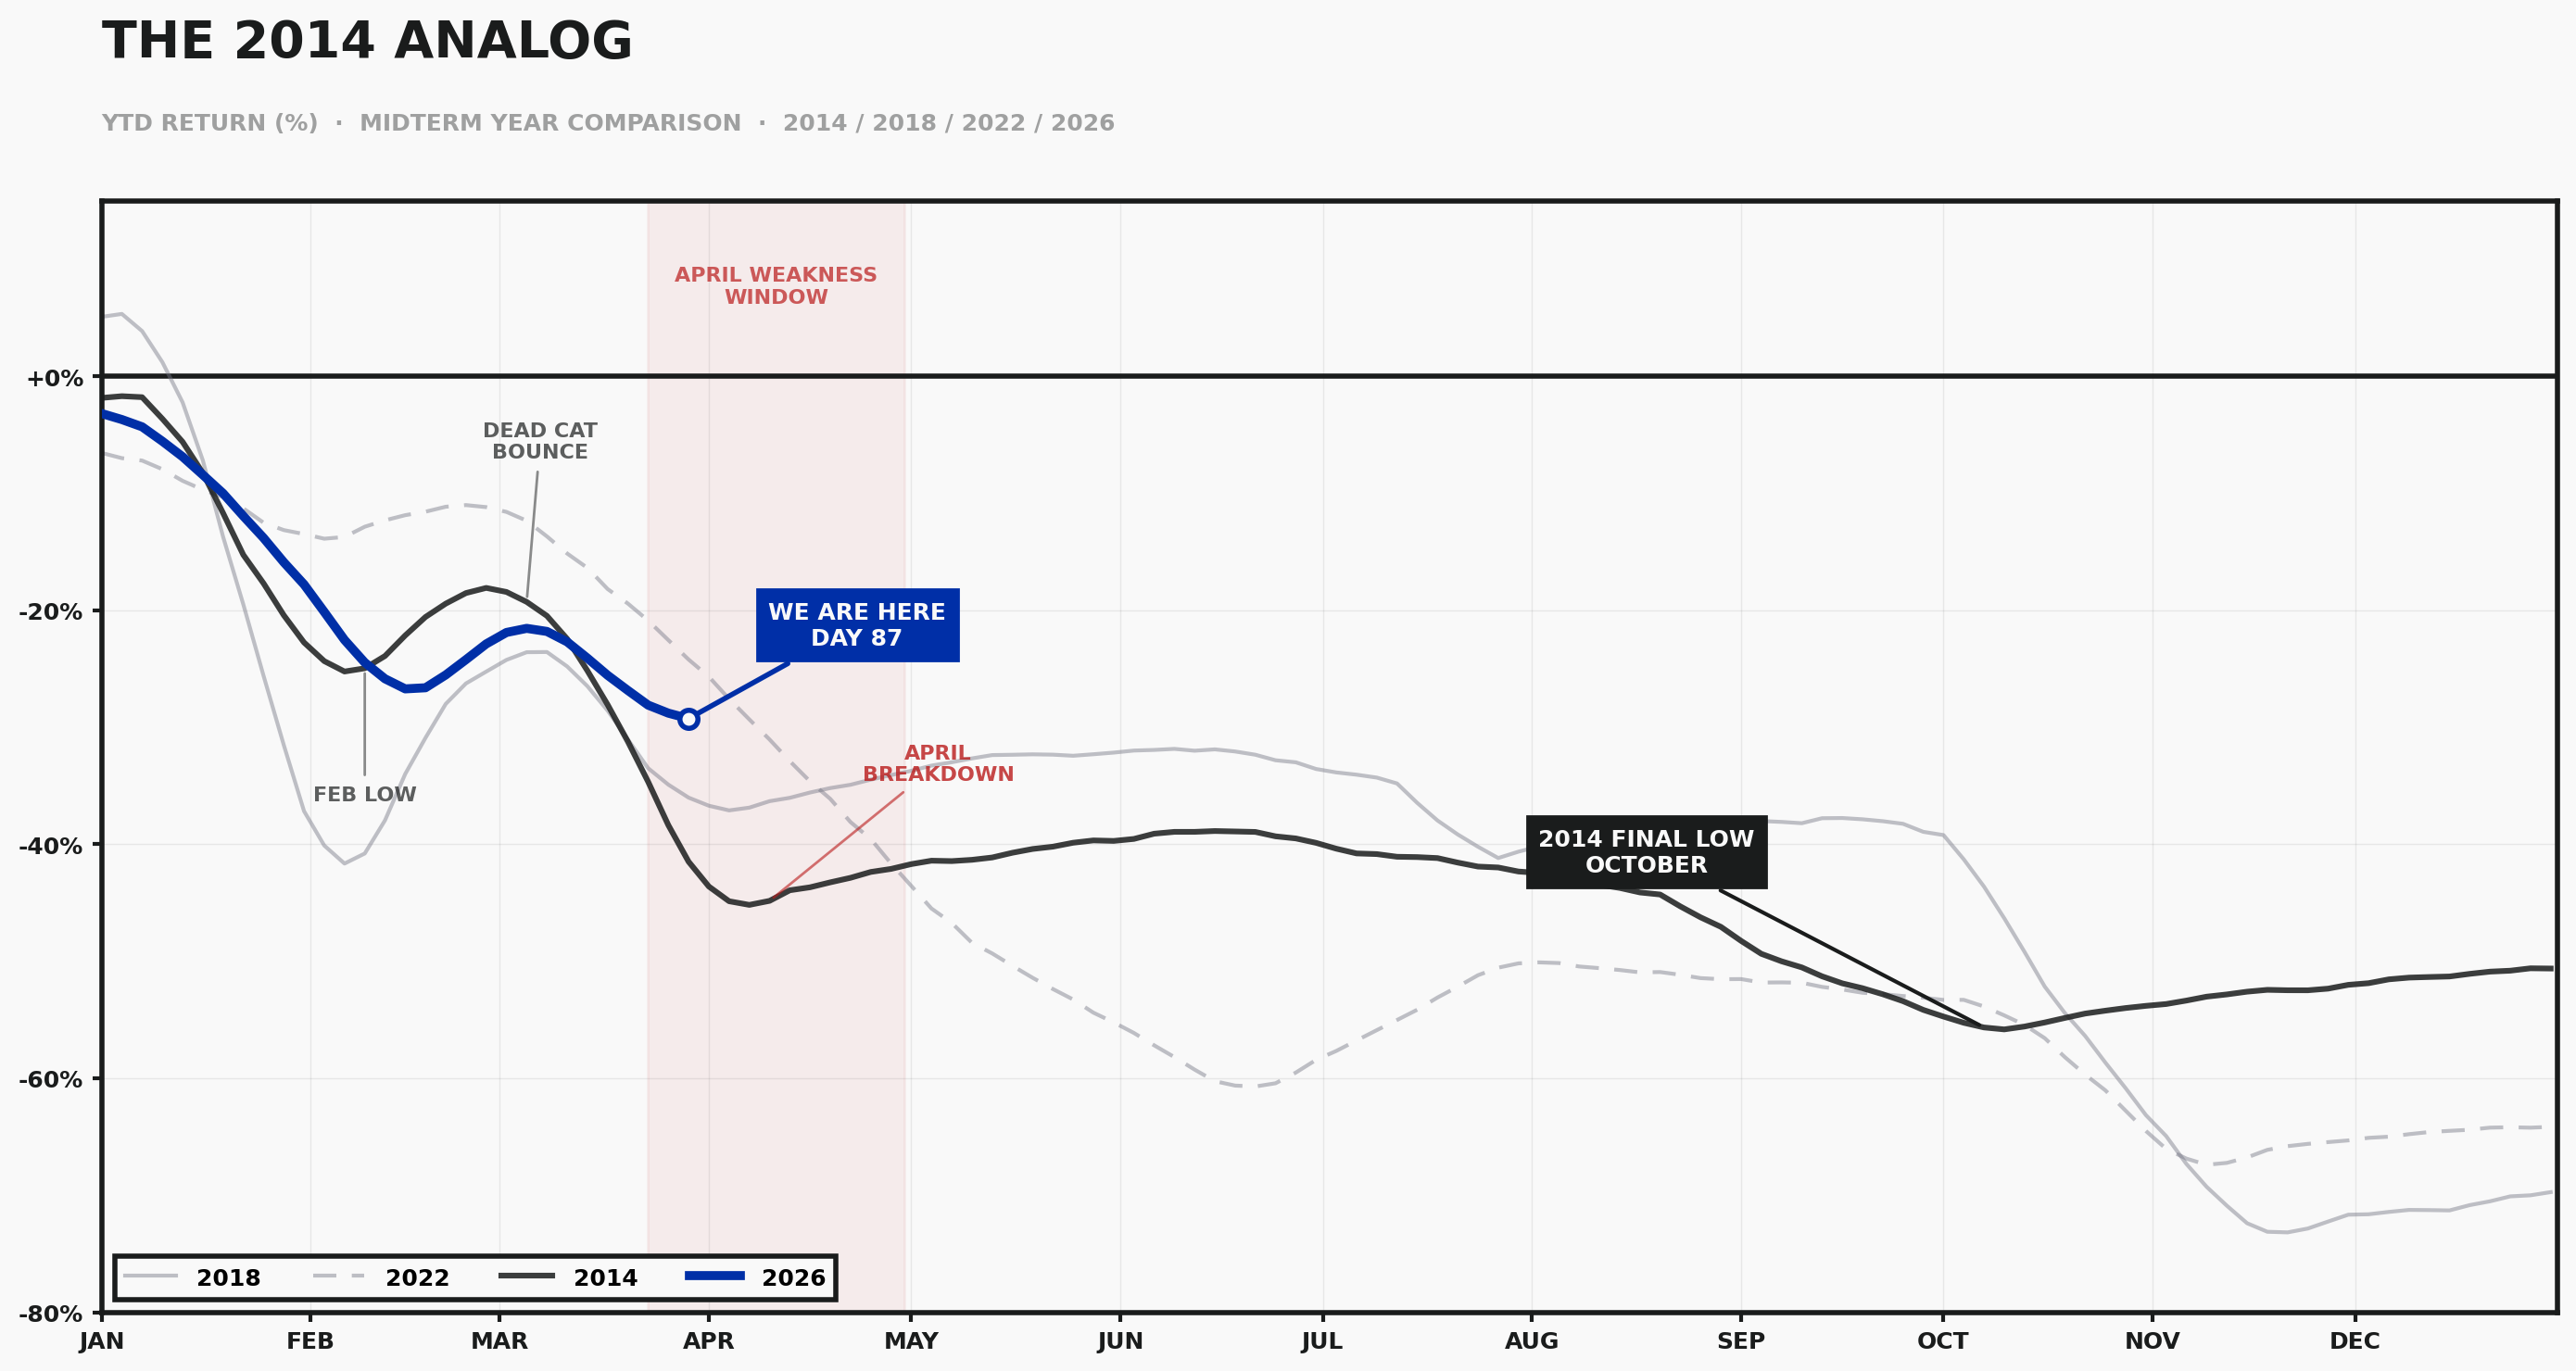
2026 (blue) is tracking the 2014 midterm year (black) most closely. The April weakness window and October final low from 2014 suggest the worst may still be months away.
3. The Bull Market Support Band
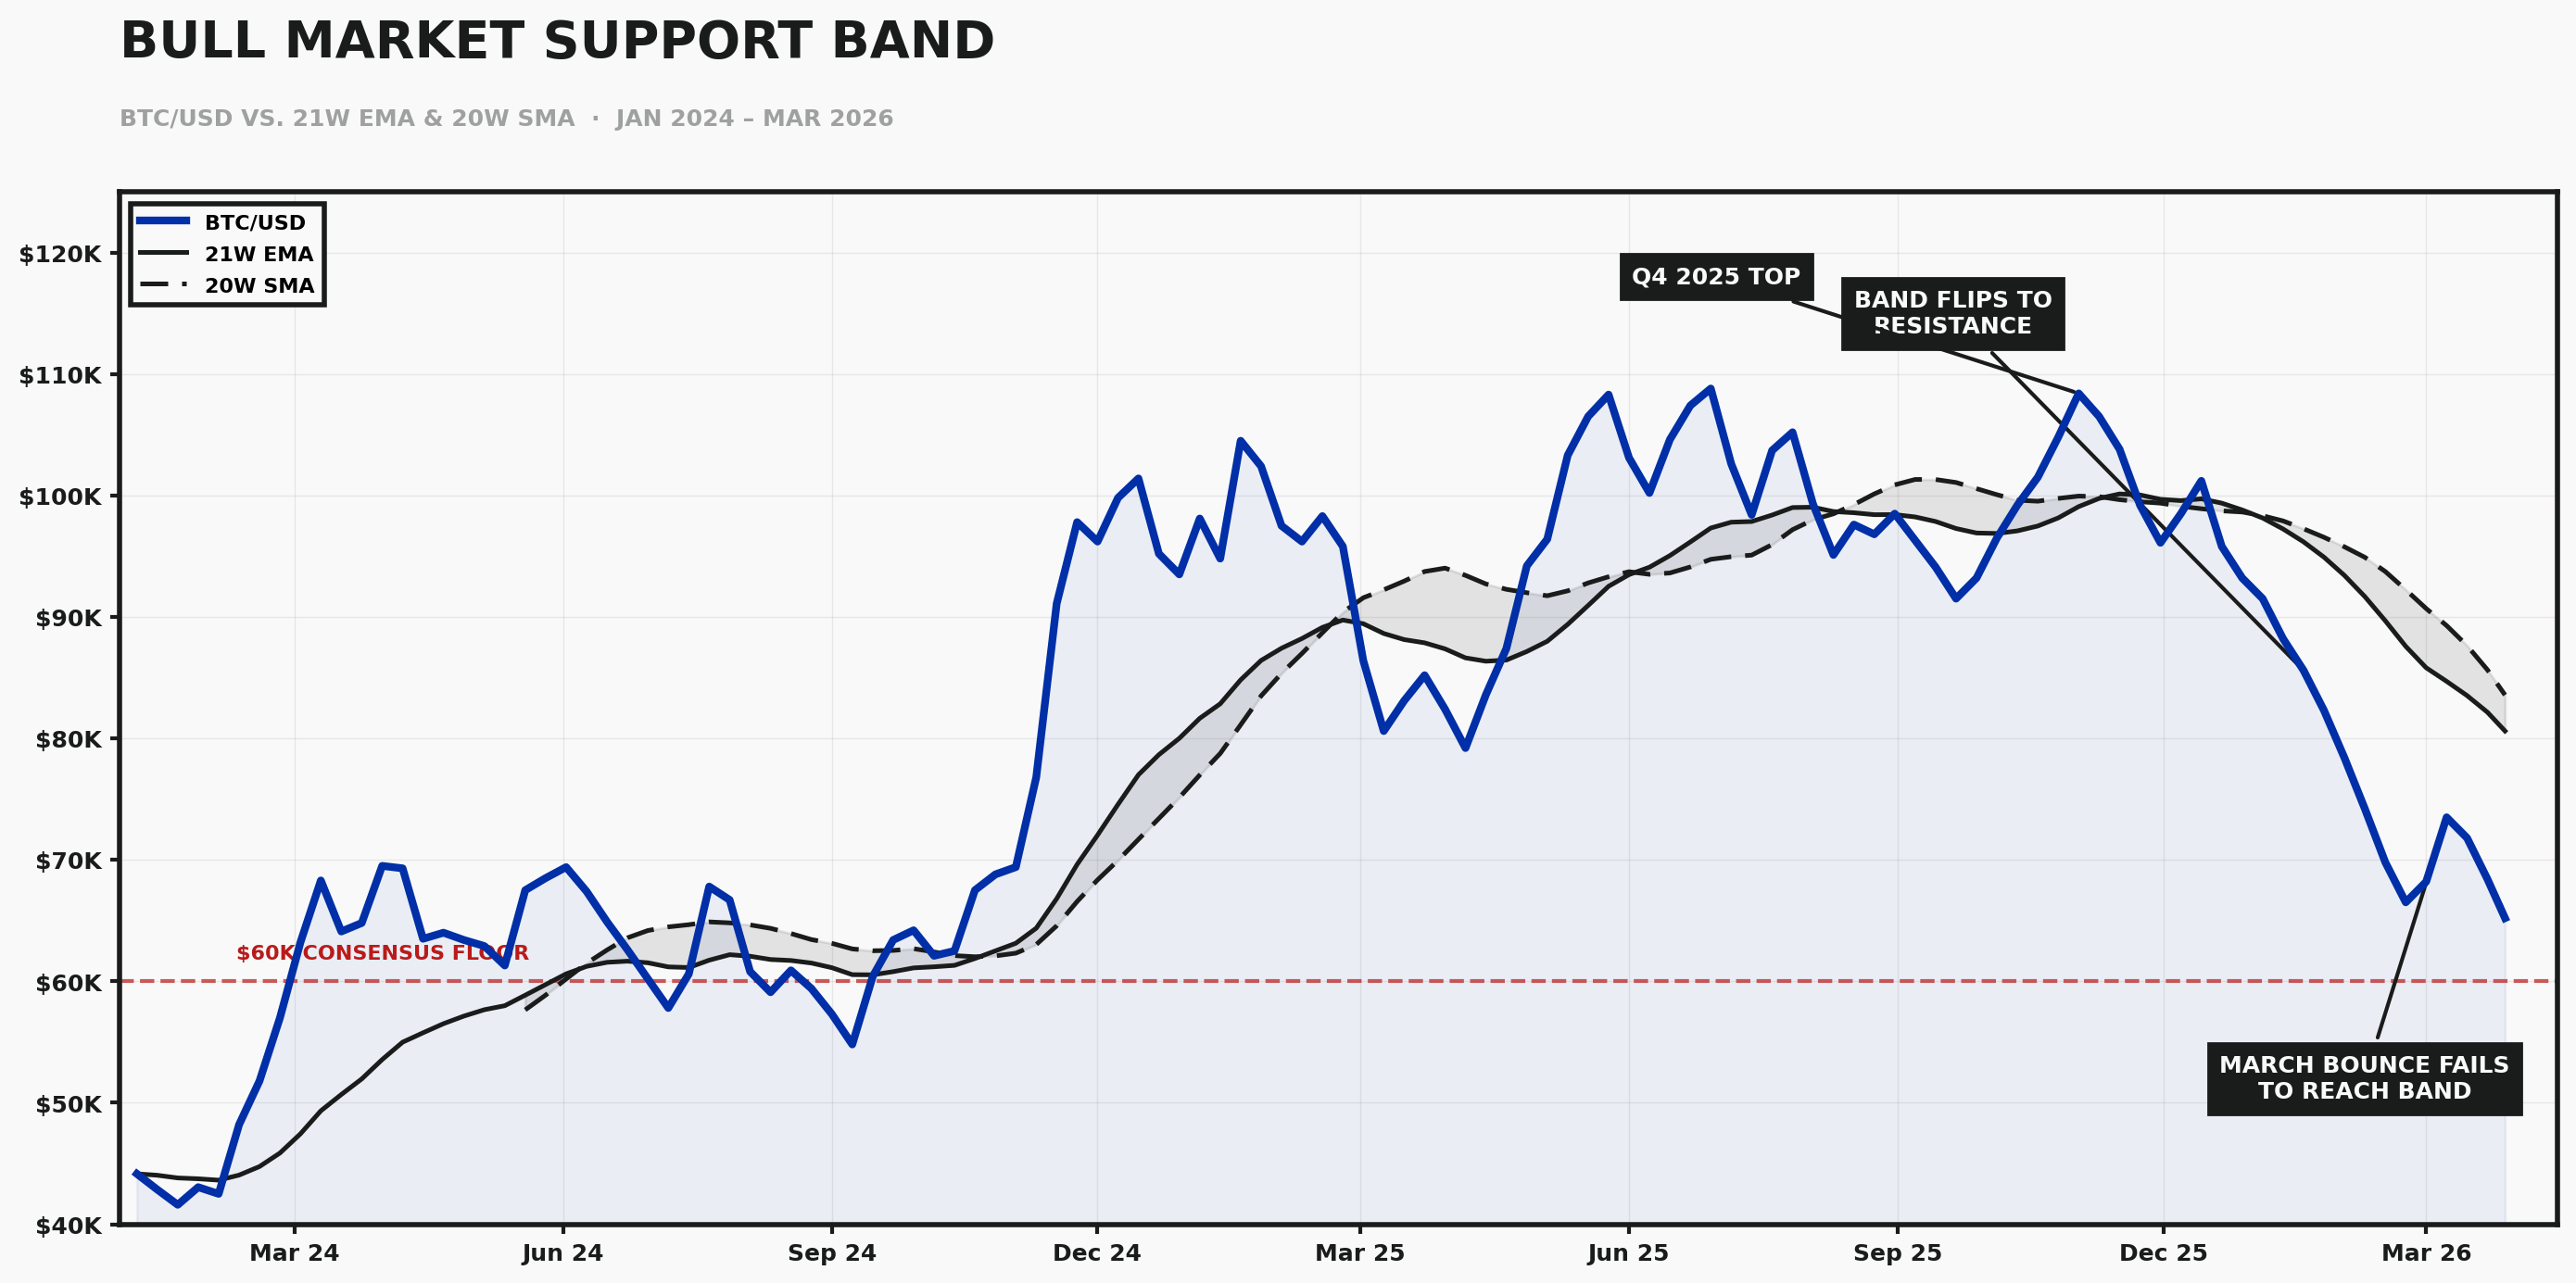
The 21-week EMA and 20-week SMA together form what traders call the Bull Market Support Band. In uptrends, Bitcoin bounces off this level. In downtrends, it becomes resistance. That flip has already happened.
What is more telling is that Bitcoin has not even been able to reach this band on its recent bounces. In both 2018 and 2022, the March rallies at least tagged the band before rolling over. In 2026, the market cannot even get there. That is not neutral. That is weakness.
Performance Matrix
Bull Market Support Band vs. BTC/USD
| Indicator | Status | Signal |
|---|---|---|
| 21-Week EMA | Acting as resistance | Bear confirmed |
| MVRV Z-Score | Still above zero | No bottom yet |
| Monthly RSI | Trending down, room to fall | Oversold traps |
| 200-Week SMA | Not yet tested | Capitulation target |
4. $60,000 Is 2018's $6,000
In 2018, the entire market was convinced that $6,000 was the floor. It held for months. Analysts drew support lines on it. Influencers built their credibility defending it. Then it broke, and Bitcoin dropped another 50% in weeks.
The $60,000 level is playing the same role today. It is the consensus floor. Everyone sees it. Everyone is positioned around it. And that is precisely why it is vulnerable. Floors that everybody agrees on do not hold in bear markets. They exist to be broken, because the break is what triggers the capitulation that actually ends the cycle.
"My base case is that Bitcoin eventually trades into the $40,000 to $50,000 range before this is over."
MVRV Z-Score
Market Value vs. Realized Value · 2020 – Mar 2026
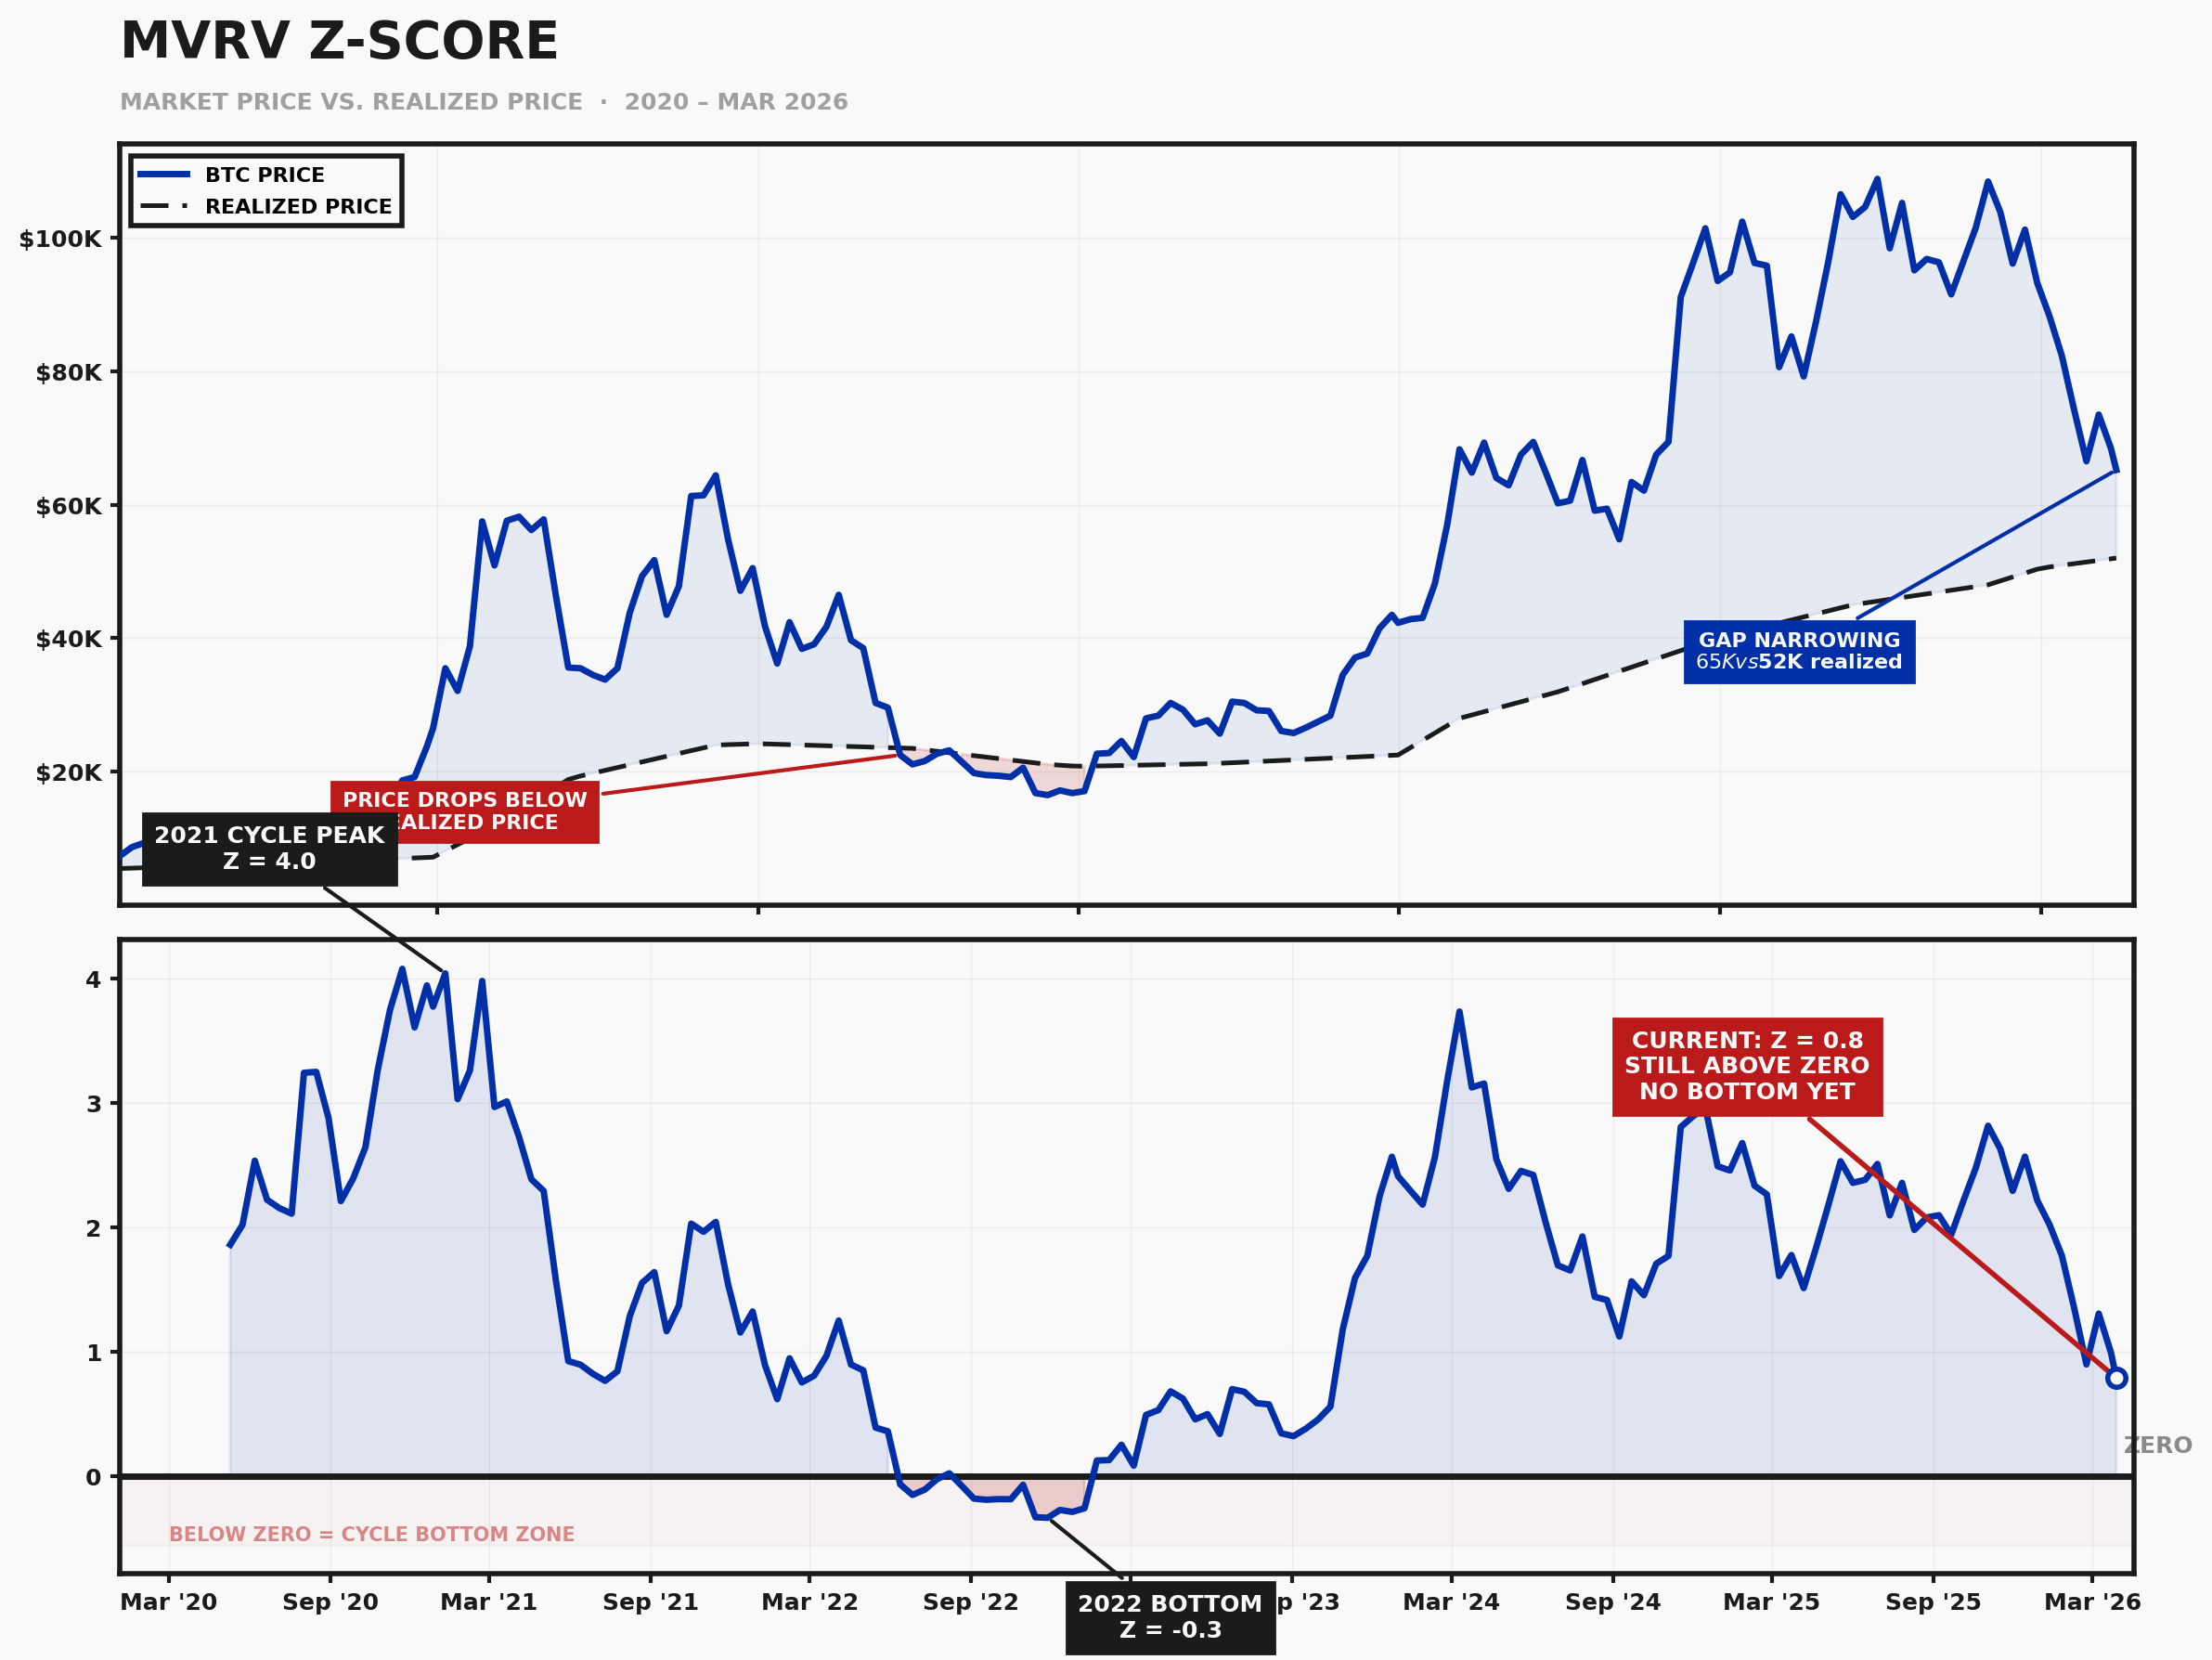
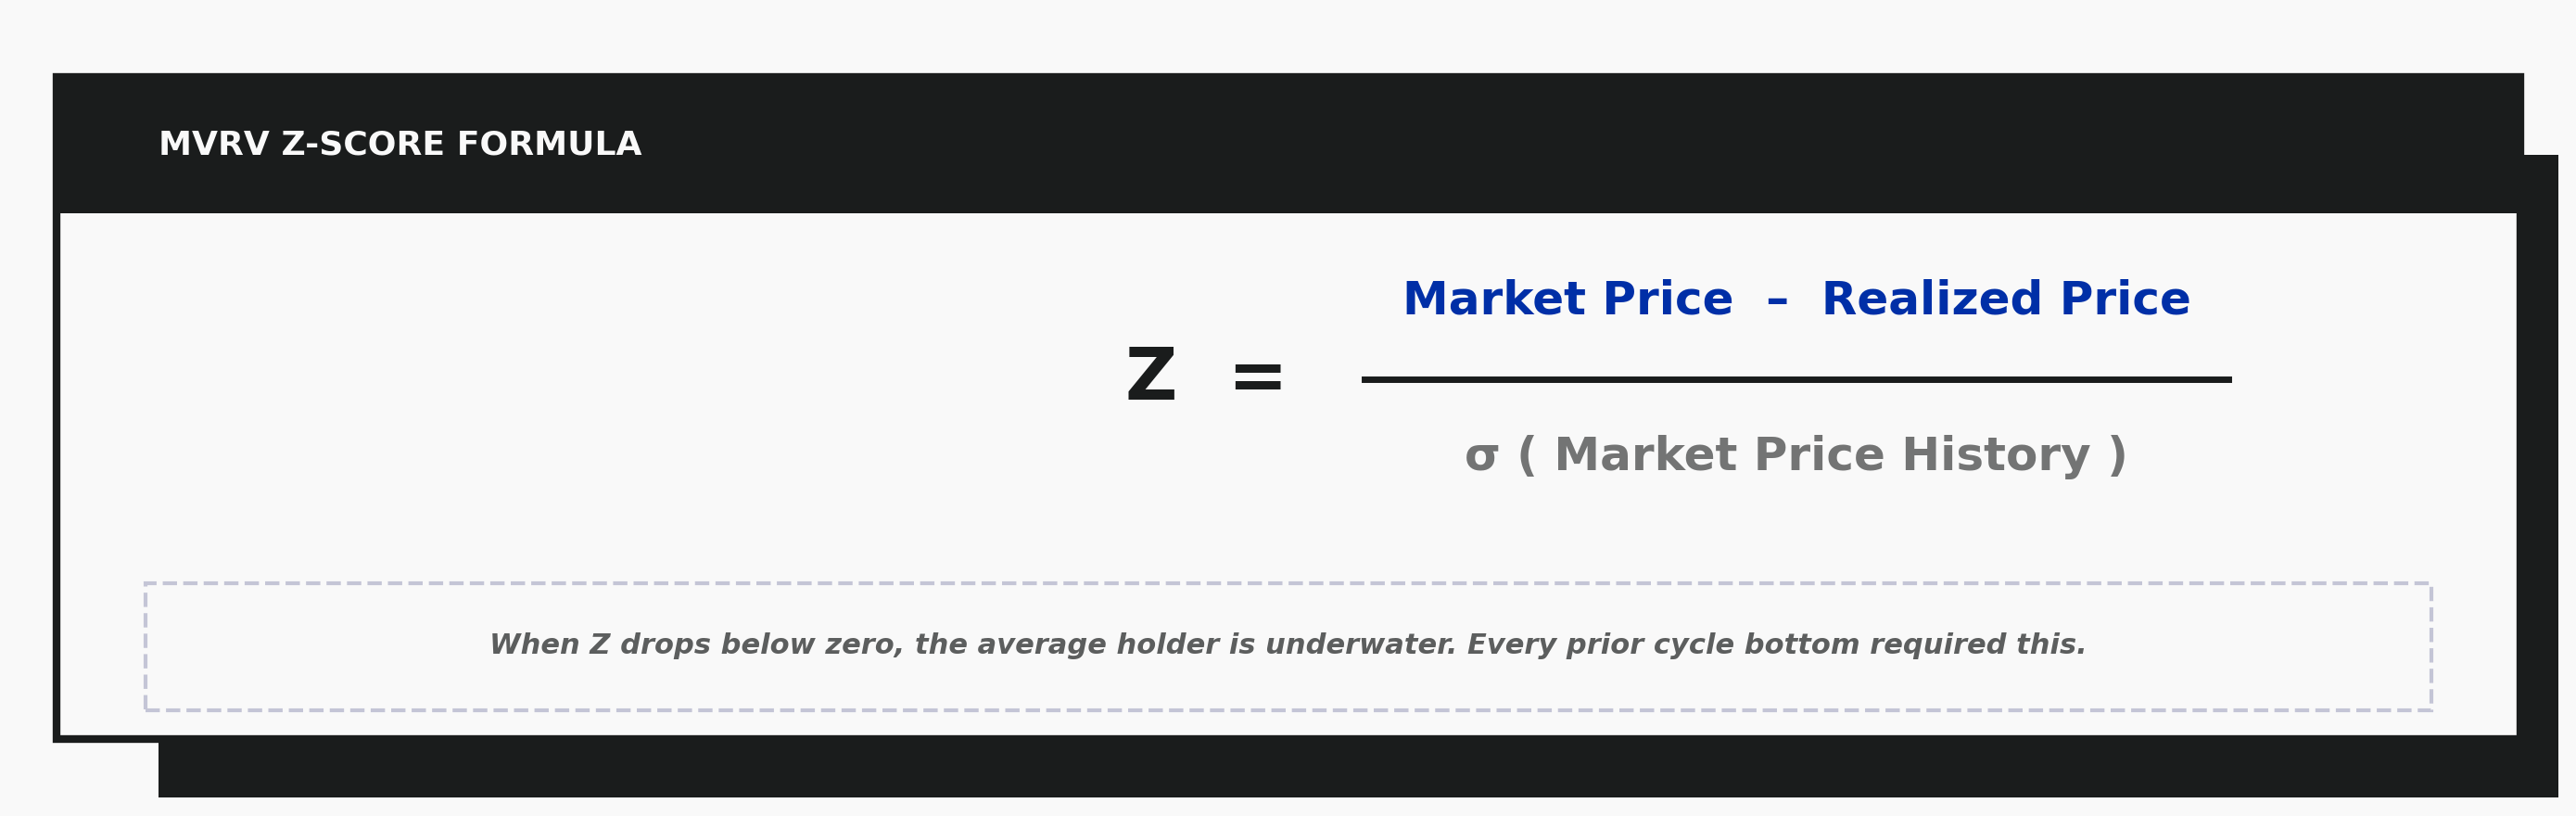
In every prior bear market bottom, the Z-Score dropped below zero (red zone). As of March 2026, the score remains positive. The cycle has not fully reset.
5. The Macro Is Not Helping
This is not just a crypto cycle. It is a late business cycle. And when those two things overlap, the damage compounds.
Risk is rolling down the curve in textbook fashion. Altcoins are bleeding against Bitcoin. Bitcoin is bleeding against equities. Equities are bleeding against Gold, which just printed near $4,000. That sequence is not random. It is what happens when capital retreats from speculation toward safety, layer by layer.
| Layer | Versus | Status |
|---|---|---|
| Altcoins | Bitcoin | Bleeding |
| Bitcoin | Equities | Bleeding |
| Equities | Gold | Bleeding |
| Gold | Cash | Near $4,000 ATH |
The labor market is the piece most people are ignoring. The headline unemployment rate still looks fine. But the Establishment Survey tells a different story: job creation has collapsed from over 6 million per year to roughly 156,000. Hiring freezes always precede layoffs. We are in the freeze. The spike comes later. And when it arrives, it tends to be nonlinear.
"Every major business cycle since the 1970s has ended with a U.S. recession. That macro reset is typically what forces Bitcoin to its final cycle low."
6. The Psychology Says We Are Not Done
The 2025 top was an "apathy top." Prices hit record levels while Google search interest and social engagement were trending down. There was no retail euphoria, no mainstream mania, no shoeshine boy moment. That is a more fragile structure than a euphoria top because there is no retail cushion to absorb selling pressure on the way down.
Bear markets do not end when the price hits a number. They end when the market runs out of hope. Right now, influencers are still aggressively bullish. The pushback against bearish analysis is loud and emotional. That is not what capitulation looks like. Capitulation is quiet. It is apathy in reverse: people stop arguing because they stopped caring.
The other trap is time. Bear markets spend far more time drifting sideways or slowly grinding up than they do crashing. That slow drift is what exhausts investors into thinking the worst is over, right before the next leg lower.
7. What I Am Watching
Three things will tell me when this cycle is actually bottoming.
| # | Signal | Why it matters |
|---|---|---|
| 01 | MVRV Z-Score Below Zero | In every prior bear market bottom, Bitcoin traded below its realized price. That has not happened yet in 2026. Until it does, I treat any rally as a lower high. |
| 02 | The Labor Market Breaking | The nonlinear unemployment spike is the macro signal that historically coincides with the final crypto flush. We are not close. |
| 03 | Narrative Death | When the permabulls go quiet and crypto Twitter stops posting charts, the bottom is near. We are not there either. |
8. Conclusion
The midterm year playbook is not a prediction. It is a pattern that has repeated in every cycle Bitcoin has ever had. The market is following the script. The question is whether you are reading it or fighting it. I think most people are still fighting it.
9. Follow Along
This is part of my ongoing 2026 Bitcoin thesis. I will continue updating my view as on-chain data, macro conditions, and market structure evolve. Follow the full thesis on the Bitcoin Thesis page.